empty
24.09.2024 06:55 PM
Analysis of GBP/USD pair on September 24th. The Pound Shows No Signs of Stopping

This image is no longer relevant

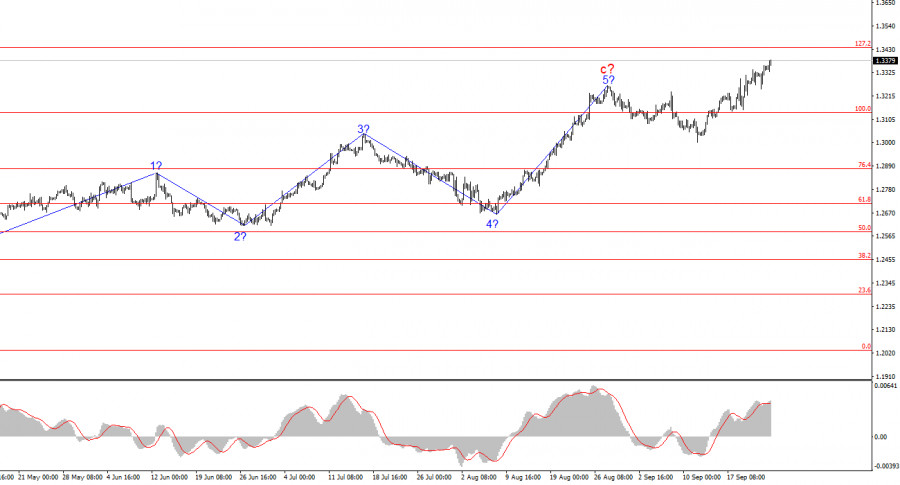
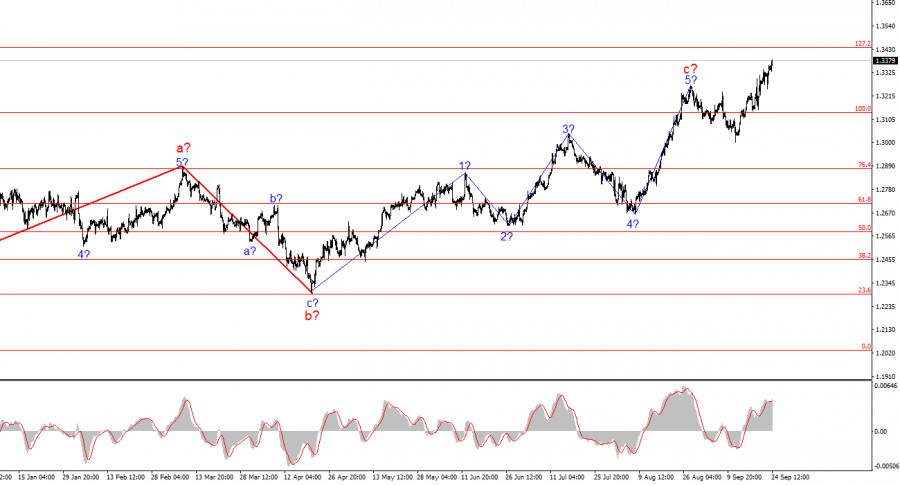
The wave pattern for GBP/USD remains complex and continues to evolve. For a while, the wave structure appeared convincing, suggesting a downward wave pattern with targets below the 1.2300 level. However, in practice, demand for the British pound continues to grow, disrupting any potential wave formations. The market tirelessly continues to build long positions.

At present, I can only assume that the upward trend, which began on April 22, has become significantly more complex. Some of the corrective waves might be transferred to a smaller scale (substructure), which would increase the number of higher ascending waves. If the current movement possesses an impulsive nature, it indicates that we are in the larger third wave, which began on August 8. If this assumption is correct, we have already observed waves 1 and 2 within it. Consequently, there is substantial space for the pound to rise further.

UK Business Activity Disappointed, but the Pound Remained Resilient

The GBP/USD pair rose by 30 points on Monday and added another 40 points today. As we can see, the rise of the British currency continues unabated, even though there was no clear fundamental reason for its strengthening yesterday or today. Yesterday, the UK's business activity indices were weaker than market expectations, reflecting some challenges within the British economy. Today, there were no significant data or news releases, yet market participants continue to increase demand for the pound.

The nearest growth target appears to be the 1.3440 level. Since the news background and common sense haven't been able to halt the pound's rise, we can only rely on significant resistance levels. The pair last traded at these price levels in March 2022. Although explaining such a surge from the 1.0450 level remains difficult, it is not the primary concern. What matters most is understanding the pair's potential next move. Currently, it is trending upwards.

The market may continue to factor in the anticipated easing of the Federal Reserve's monetary policy, but it's impossible to predict how much longer this will last. Therefore, the most prudent approach is to monitor the pair's movement from one level to the next. Presently, news events seem to have little impact on the pair's rate, but new negative data from the U.S. could further strengthen buyer interest. If traders are willing to buy the pair without solid reasons, what will occur when strong reasons materialize? The upcoming FOMC meeting may lead to another rate cut, while the Bank of England might opt to pause again. Based on this scenario, the pound could continue to appreciate, given the current market dynamics.

This image is no longer relevant

General Conclusions

The wave structure for GBP/USD continues to evolve. If the upward trend began on April 22, it has already taken on a five-wave form but could become significantly more extended. I still find selling the pair more attractive, but clear signals are required. Currently, there is no doubt that a new upward wave is forming. The nearest target for this wave is the 1.3440 level, which corresponds to the 127.2% Fibonacci level.

On a larger wave scale, the wave structure has transformed. We can now assume the formation of a complex and extended upward corrective pattern. At present, it's a three-wave pattern, but it could evolve into a five-wave structure, which might take several more months to complete.

Key Principles of My Analysis:

  1. Wave structures should be simple and clear. Complex structures are hard to interpret and often undergo changes.
  2. If you are uncertain about the market, it's better to stay out.
  3. There is never absolute certainty about market direction. Always use protective Stop Loss orders.
  4. Wave analysis can be combined with other types of analysis and trading strategies.
Chin Zhao,
Analytical expert of InstaForex
© 2007-2025
Select timeframe
5
min
15
min
30
min
1
hour
4
hours
1
day
1
week
Earn on cryptocurrency rate changes with InstaForex
Download MetaTrader 4 and open your first trade
  • Grand Choice
    Contest by
    InstaForex
    InstaForex always strives to help you
    fulfill your biggest dreams.
    JOIN CONTEST

Recommended Stories

EUR/USD Analysis – April 1: EU Inflation Continues to Fall

The wave structure on the 4-hour EUR/USD chart risks evolving into a more complex formation. On September 25 of last year, a new bearish structure began to take shape, forming

Chin Zhao 20:05 2025-04-01 UTC+2

Analysis for GBP/USD on April 1, 2025

The wave structure for GBP/USD remains somewhat ambiguous but generally manageable. Currently, there is a high probability of a long-term bearish trend formation. Wave 5 has taken on a convincing

Chin Zhao 20:00 2025-04-01 UTC+2

EUR/USD Analysis – March 31st

The wave structure on the 4-hour EUR/USD chart is at risk of transforming into a more complex formation. On September 25 of last year, a new downward structure began forming

Chin Zhao 20:10 2025-03-31 UTC+2

GBP/USD Analysis – March 31: The Pound Takes a Break

The wave structure for GBP/USD remains somewhat ambiguous, though overall acceptable. Currently, there is still a high probability of a long-term downward trend formation. Wave 5 has taken a convincing

Chin Zhao 20:08 2025-03-31 UTC+2

Weekly Forecast Based on Simplified Wave Analysis for GBP/USD, AUD/USD, USD/CHF, EUR/JPY, #Ethereum, and #Litecoin as of March 31

In the coming days, a flat phase in the movement of the British pound is expected to come to an end. In the second half of the week, a reversal

Isabel Clark 11:43 2025-03-31 UTC+2

Weekly Forecast Based on Simplified Wave Analysis for EUR/USD, USD/JPY, GBP/JPY, USD/CAD, #Bitcoin, and #Ripple – March 31

In the coming days, a completion of the downward movement in the euro exchange rate is likely, potentially reaching the lower boundary of the calculated support zone. A reversal

Isabel Clark 11:12 2025-03-31 UTC+2

EUR/USD Analysis – March 28th

The wave structure on the 4-hour chart for EUR/USD threatens to evolve into a more complex formation. A new downward structure began forming on September 25, taking the shape

Chin Zhao 19:10 2025-03-28 UTC+2

GBP/USD Analysis – March 28th

The wave structure of the GBP/USD instrument remains somewhat ambiguous, but overall digestible. At this stage, there is a strong likelihood that a long-term downward trend segment is forming. Wave

Chin Zhao 19:07 2025-03-28 UTC+2

Analysis for GBP/USD on March 27, 2025

The wave pattern for GBP/USD remains somewhat ambiguous, but overall, it is manageable. There is still a high probability of a long-term downward trend developing. Wave 5 has taken

Chin Zhao 18:07 2025-03-27 UTC+2

Analysis for GBP/USD on March 26, 2025

The wave pattern for GBP/USD remains somewhat ambiguous but overall workable. There is still a high probability of a long-term bearish trend forming. Wave 5 has taken a clear shape

Chin Zhao 17:37 2025-03-26 UTC+2
Can't speak right now?
Ask your question in the chat.
Widget callback
 

Dear visitor,

Your IP address shows that you are currently located in the USA. If you are a resident of the United States, you are prohibited from using the services of InstaFintech Group including online trading, online transfers, deposit/withdrawal of funds, etc.

If you think you are seeing this message by mistake and your location is not the US, kindly proceed to the website. Otherwise, you must leave the website in order to comply with government restrictions.

Why does your IP address show your location as the USA?

  • - you are using a VPN provided by a hosting company based in the United States;
  • - your IP does not have proper WHOIS records;
  • - an error occurred in the WHOIS geolocation database.

Please confirm whether you are a US resident or not by clicking the relevant button below. If you choose the wrong option, being a US resident, you will not be able to open an account with InstaForex anyway.

We are sorry for any inconvenience caused by this message.