empty
15.11.2021 07:05 AM
Buying and selling on stock market on November 15

Buying Baidu's stock is hedged by selling Comcast.

Buying Baidu's stock(#BIDU). Chinese Internet service, search engine.

This image is no longer relevant

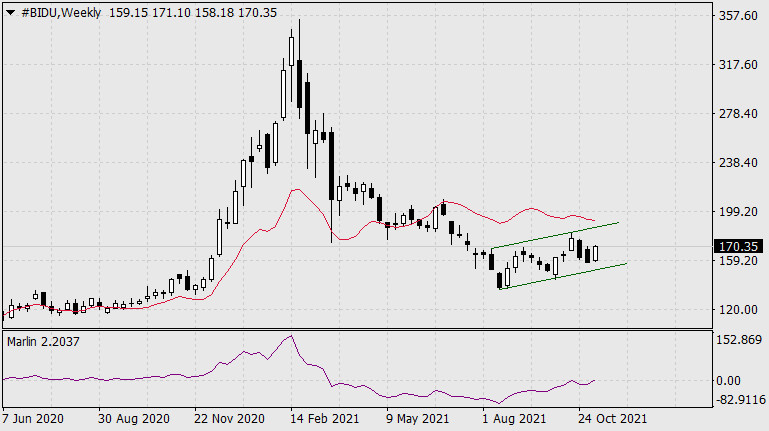
On the weekly chart, the signal line of the Marlin oscillator has overcome the boundary of the bulls' territory. The price is developing in the local rising price channel. Price growth to its upper boundary is likely with the probable exit from it. Let's discuss the details on a daily chart.

This image is no longer relevant

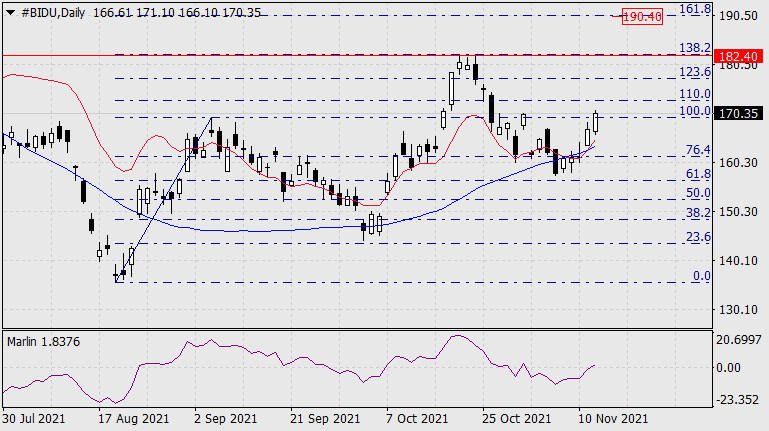
On the daily chart, the price has consolidated above the balance and Kruzenshtern indicator lines, the Marlin oscillator has entered the zone of positive values, i.e. the price moves into the area of predominant growth. The first movement target is the 138.2% Fibonacci level at 182.40. Besides, it is also a resistance level on October 20-22 and support on June 16-21. The second target is the 161.8% Fibonacci level at 190.40.

Selling Comcast Corporation's stock(#CMCSA). US telecommunications corporation.

This image is no longer relevant

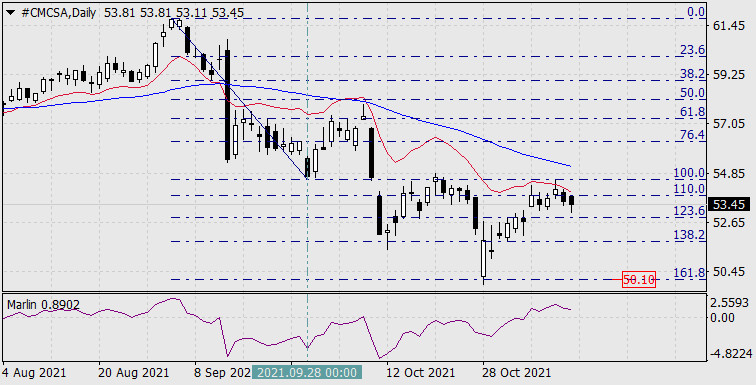
On the daily chart, it is possible to observe that on the third bar the price reversed from the 100.0% Fibonacci level, the low of September 28 and resistance of October 20-21. At the same time, the price did not cross over the red indicator balance line. This fact indicates that the price growth occurred within the correction. The trend is descending and now the price is reversing to the direction of its new wave. The Marlin oscillator is turning downward. The nearest movement target is the 161.8% Fibonacci level at the price of 50.10.

Laurie Bailey,
Analytical expert of InstaForex
© 2007-2025
选择时间框架
5
分钟
15
分钟
30
分钟
1
小时
4
小时
1
1
通过InstaForex赚取加密货币汇率变动的收益。
下载MetaTrader 4并开启您的第一笔交易。
  • Grand Choice
    Contest by
    InstaForex
    InstaForex always strives to help you
    fulfill your biggest dreams.
    JOIN CONTEST

推荐文章

在邊緣遊戲:市場能否再度忽視地緣政治?

美國股市繼續無視地緣政治現實。指數已接近關鍵水平,準備突破。

Anna Zotova 13:27 2025-06-17 UTC+2

5月17日股市:S&P 500和NASDAQ

在最近一個交易日結束時,美國股市指數收高。S&P 500上漲0.94%,而納斯達克100指數上漲1.55%。

Jakub Novak 11:56 2025-06-17 UTC+2

6月17日美國股市最新情況

S&P500 週一美國主要股指的快照:道瓊斯指數上漲0.8%,納斯達克上漲1.5%,S&P 500上漲0.9%,S&P 500在 5,600 到 6,200 的盤中範圍內達到 6,033。 週一,美國股市重新整合,收復了週五的大部分失地,這得益於以色列與伊朗的衝突仍相對被控制,並未對石油供應造成顯著中斷的了解。

Jozef Kovach 10:45 2025-06-17 UTC+2

市場前線:通脹、飛彈及企業報告:何者將率先拖累股市?

美國股市處於十字路口。雖然股市已從恐慌性拋售中復甦,展現了其強勁的韌性,但尚未給出持續趨勢的明確信號。

Anna Zotova 17:05 2025-06-16 UTC+2

美國市場在以色列與伊朗戰爭中的情況

S&P 500 概況於16.06 美國市場在以色列–伊朗戰爭中的情況 週五的主要美國指數:道瓊 -1.8%,納斯達克 -1.3%,S&P 500 -1.1%,S&P 500 於 ,5977,區間5,600–6,200。 由於對以色列和伊朗之間戰爭的擔憂,股市在本周結束時表現疲弱,這種擔憂超過了對錯失股市進一步上漲的恐懼。

Jozef Kovach 13:52 2025-06-16 UTC+2

5月16日股市:S&P 500和NASDAQ收低

在上一個常規交易日結束時,美國股市指數收於負值區域。S&P 500 指數下跌 1.13%,而納斯達克 100 指數下跌 1.30%。

Jakub Novak 10:43 2025-06-16 UTC+2

5月13日股市:S&P 500和NASDAQ

在前一次常規交易時段,美國股指收盤走高,但隨後情況發生了顯著變化。S&P 500 指數上漲 0.38%,納斯達克 100 指數上漲 0.24%,道瓊斯工業平均指數上升 0.24%。

Jakub Novak 12:17 2025-06-13 UTC+2

美國市場:以色列攻擊伊朗核設施,市場下跌,石油和黃金上漲

S&P 500 6月13日概況 美國市場:因以色列打擊伊朗,市場下跌 週四美國主要指數:道指+0.2%,納斯達克+0.2%,S&P 500+0.4%,S&P 500在6045,範圍為5600 – 6200。 截至週五早上:以色列進行了對伊朗的大規模空襲,目標是核設施及參與伊朗核計畫領導的個人。

Jozef Kovach 11:59 2025-06-13 UTC+2

6月12日股市:標普500和納斯達克小幅下跌

在上一個常規交易日結束時,美國股指收低。S&P 500 下跌了 0.27%,而 Nasdaq 100 下跌了 0.50%。

Jakub Novak 12:00 2025-06-12 UTC+2

金融平台還是跳板?市場增長停滯背後的原因是什麼?

美國市場正保持穩定,但不再上升。市場已達到預測的峰值,卻未找到新的動力推高至下一個階段。

Anna Zotova 14:09 2025-06-11 UTC+2
现在无法通话?
提出您的问题,用 在线帮助.
Widget callback