EUR/USD 5M
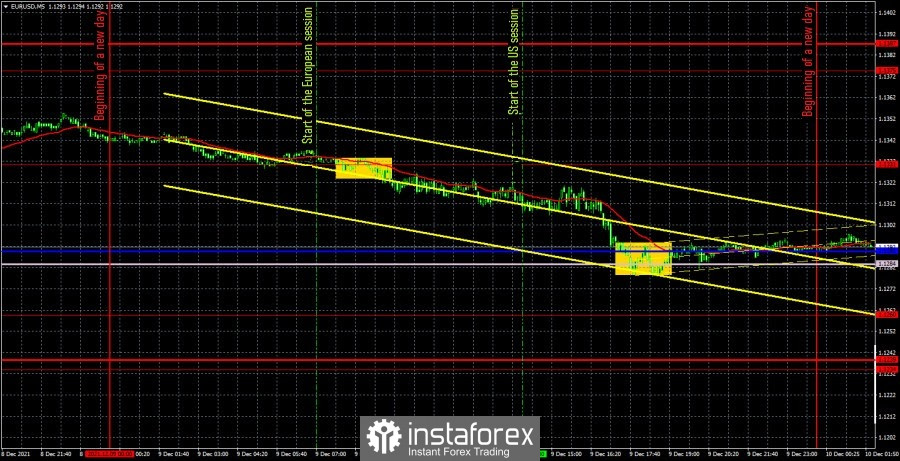
The EUR/USD pair traded very well during the penultimate trading day of the week. There was a movement in one direction for almost the entire day, a trend. And this is the best kind of movement that can be. There was not a single important fundamental event, either in the European Union or in the United States, on Thursday. Also, not a single important report has been published. Therefore, during the day, traders could only rely on technical signals when making trading decisions. Actually, let's consider them. There weren't many of them yesterday. Just two. The first was formed at the very beginning of the European trading session in the form of a breakthrough of the 1.1331 level. Traders should have opened short positions on this signal. The next signal was formed in the evening, when the price reached the Senkou Span B and Kijun-sen lines. For a whole hour, the pair could not overcome them or bounce off them. Therefore, a short position should have been closed manually simply because it was already evening, and we do not recommend postponing deals to the next day when trading small timeframes. Thus, the profit on the short position was about 35 points. Considering that the overall volatility of the day was 68 points, this is a good result. And the US dollar, meanwhile, is again rising in price against the euro and is again moving towards renewing its annual lows. Moreover, without any statistics and fundamental events.
EUR/USD 1H
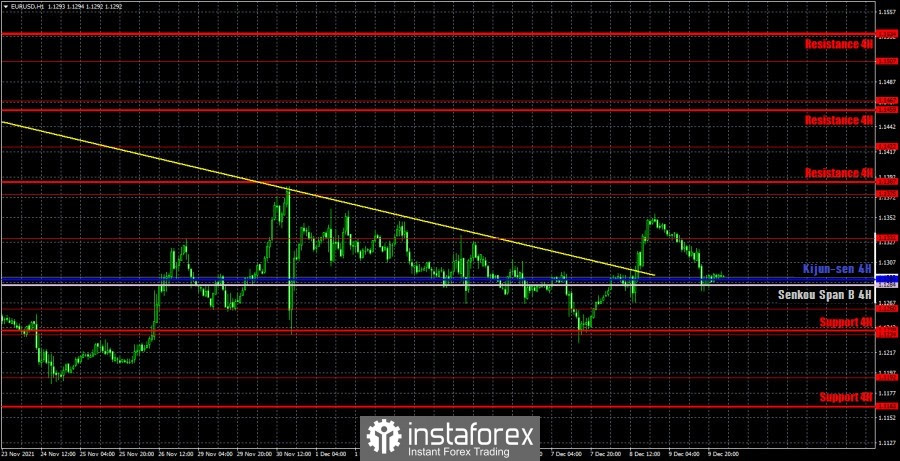
The pair crossed the downtrend line on the hourly timeframe, so the trend formally changed to an upward one. However, the price has already rushed down on Thursday. So far, we cannot conclude that the downward trend has resumed, since the pair has not yet been able to overcome the important Senkou Span B and Kijun-sen lines. A rebound from them can provoke a resumption of upward movement. We highlight the following levels for trading on Thursday - 1.1192, 1.1234, 1.1260, 1.1331, 1.1375, as well as the Senkou Span B (1.1284) and Kijun-sen (1.1290) lines. The Ichimoku indicator lines can change their position during the day, which should be taken into account when looking for trading signals. Signals can be rebounds or breakthroughs of these levels and lines. Do not forget about placing a Stop Loss order at breakeven if the price moves 15 points in the right direction. This will protect you against possible losses if the signal turns out to be false. European Central Bank President Christine Lagarde will deliver a speech in the European Union on December 10, who on the eve of the meeting can share important information. But the likelihood of this, again, is not high. The US inflation report is far more significant, which will be published in the afternoon. It is this report that can provoke a strong movement of the euro/dollar pair. We assume that another acceleration of US inflation may lead to a rise in the dollar. The University of Michigan Consumer Sentiment Index is unlikely to be of much interest to anyone.
We recommend you to familiarize yourself:
Overview of the EUR/USD pair. December 10. Americans expect the economic situation to deteriorate.
Overview of the GBP/USD pair. December 10. The UK enters Plan B because of Omicron. Boris Johnson again gets into a scandal.
Forecast and trading signals for GBP/USD for December 10. Detailed analysis of the movement of the pair and trade deals.
Analysis of the COT report
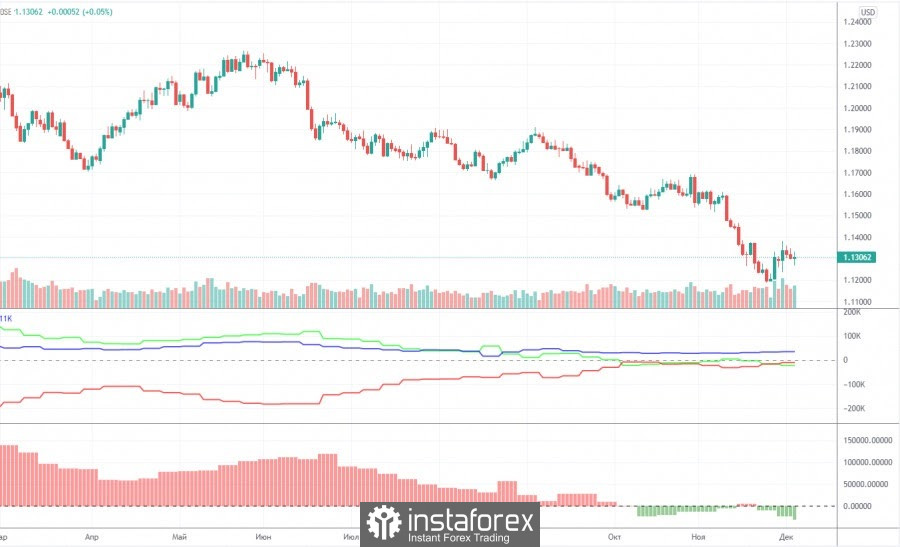
The mood of non-commercial traders became more bearish again during the last reporting week (November 23-29). Judging by the indicators in the chart above, the changes are not so big anymore, but still most professional traders continue to either increase shorts or reduce longs. The non-commercial group closed 15,000 Buy contracts (longs) and 8,500 Sell contracts (shorts) during the reporting week. Thus, their net position decreased by 6,500 contracts. Indeed, a little. The green line of the first indicator has been near the zero level for a long time. And this, by and large, means that the number of open longs and shorts for non-commercial traders is approximately the same. And this, in turn, means that the mood is now more neutral than bearish. But still, almost every week there is an increase in this "weak bearish mood", so now we can conclude that the European currency has excellent chances to continue falling. We just want to remind you about the factor of the market working out the reasons that could bring the dollar so high against the euro. From our point of view, the US currency as a whole continues to grow due to the fact that the probability of tightening the monetary policy of the Federal Reserve is much higher than the probability of tightening the monetary policy of the ECB. Especially now, when EU countries are beginning to close for quarantine and break anti-records on morbidity. However, the dollar has been growing for a very long time, and the Fed, in fact, has only reduced the QE program by $15 billion and that's it. Thus, the factor of a high probability of tightening the Fed's monetary policy has been worked out several times for a long time.
Explanations for the chart:
Support and Resistance Levels are the levels that serve as targets when buying or selling the pair. You can place Take Profit near these levels.
Kijun-sen and Senkou Span B lines are lines of the Ichimoku indicator transferred to the hourly timeframe from the 4-hour one.
Support and resistance areas are areas from which the price has repeatedly rebounded off.
Yellow lines are trend lines, trend channels and any other technical patterns.
Indicator 1 on the COT charts is the size of the net position of each category of traders.
Indicator 2 on the COT charts is the size of the net position for the non-commercial group.


