GBP/USD 5M
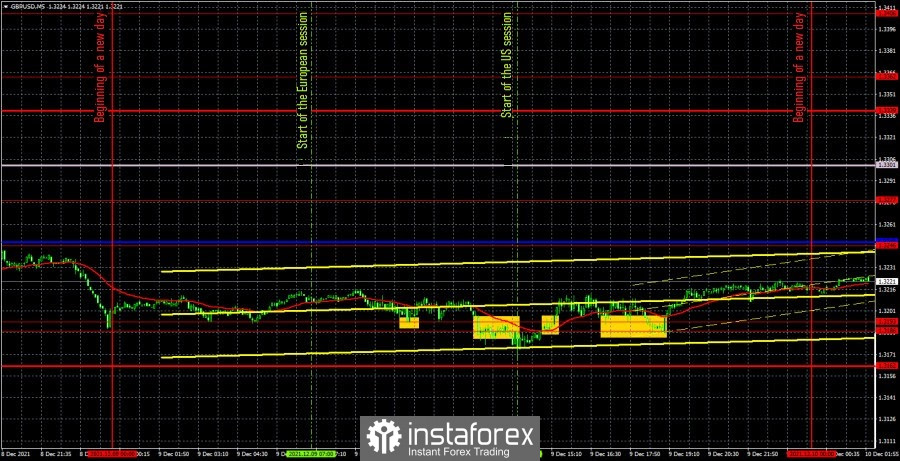
The GBP/USD pair was trading not in the best way on Thursday. If the European currency has been in a downward movement all day, which allowed traders to make money, then the pound was flat. The overall volatility of the day was about 50 points, which is not just a little for the pound/dollar pair, it is minuscule. Thus, there could be no question of any strong signals. Also, we have already drawn traders' attention to the fact that at this time there was an uncorrelation between the two main pairs. The pound and the euro are moving differently. In addition, there was no important macroeconomic statistics or fundamental background during the day today. Nevertheless, the euro has found the strength to show a trend movement, while the pound has not. Thus, all we have to do is analyze the trading signals and find out how we should have traded yesterday. All trading signals were formed around one area (1.3186-1.3193), which is very typical during a flat. The first buy signal was generated when the price bounced off the 1.3193 level. Since at that time it was still unclear that the pair was in a flat, traders had to work out this signal, which, of course, turned out to be false: the price could not go up 10 points. Subsequently, it closed under the 1.3186-1.3193 area, which should be interpreted as a sell signal. However, it turned out to be false, and this time the price could not go even 10 points after the formation. Thus, two false signals in a row, which brought a cumulative loss of about 40 points. This is one of the largest loss-making values in recent months. Unfortunately, these days happen too. On Wednesday, the pair made it possible to make money on a not very good movement, on Thursday it took away the debt. All subsequent signals should not have been processed any more, since at that moment two false signals had already been generated near the indicated area.
GBP/USD 1H
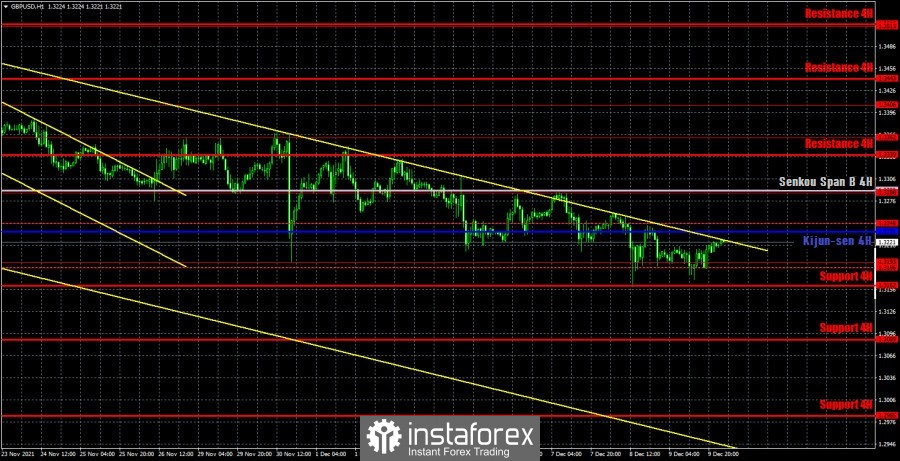
On the hourly timeframe, the pound/dollar pair maintains a downward trend, as it is still located within the downward channel, from the upper border of which it has rebounded seven times over the past ten days. Thus, the British pound is already simply tormented by this line, which it cannot overcome in any way. If the bulls still find the strength to settle above the channel, then the trend will change to an upward trend at least for some time. We distinguish the following important levels on December 10: 1.3186-1.3193, 1.3246, 1.3288, 1.3362, 1.3406. There are no levels below, since the price has not been so low for over a year. Senkou Span B (1.3290) and Kijun-sen (1.3235) lines can also be signal sources. Signals can be "rebounds" and "breakthroughs" of these levels and lines. It is recommended to set the Stop Loss level at breakeven when the price passes 20 points in the right direction. The Ichimoku indicator lines can move during the day, which should be taken into account when looking for trading signals. Quite important reports on industrial production and GDP will be published in the UK on Friday. This data can be worked out by traders, however, there will be a much greater probability of a strong movement after the publication of the US inflation report in the afternoon. We believe traders will mainly focus on this particular report.
We recommend you to familiarize yourself:
Overview of the EUR/USD pair. December 10. Americans expect the economic situation to deteriorate.
Overview of the GBP/USD pair. December 10. The UK enters Plan B because of Omicron. Boris Johnson again gets into a scandal.
Forecast and trading signals for EUR/USD for December 10. Detailed analysis of the movement of the pair and trade deals.
COT report
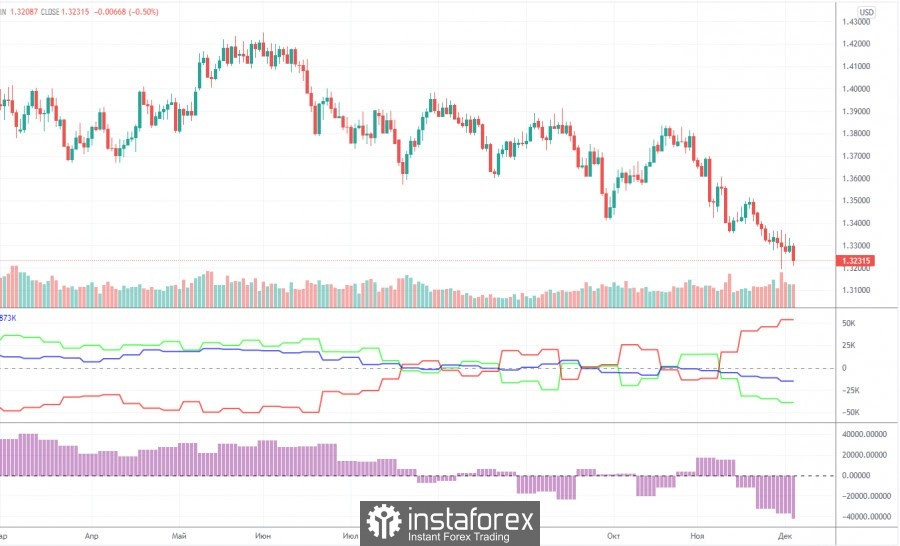
The mood of professional traders became a little more bearish during the last reporting week (November 23-29). In principle, quite unexpectedly, the bears became almost twice as strong as the bulls. Recall that since about August, the bulls and bears could not decide who to dominate the market. This is clearly seen by the two indicators in the chart above: the net position of the "non-commercial" group was constantly jumping from side to side. However, in the last few weeks, professional traders have increased the number of shorts to 93,000, and the number of longs has remained at 51,000. Thus, at this time, the mood can really be described as bearish. Consequently, it can be concluded that the pound will continue to fall. However, as always, it does not do without one "but". The red and green lines of the first indicator, which indicate the net positions of commercial and non-commercial traders, the two most important and large groups, have moved quite far from each other. They were at about the same distance in May-June, when the upward trend ended. And a strong distance from each other of these two lines just means that the trend may end. Of course, if the demand for the dollar does not decline, and there is still the same negative fundamental background in the UK, then nothing will prevent the US currency from continuing to grow. However, a further fall in the pound will mean that the number of shorts will continue to grow. And it already exceeds the number of longs by almost twice.
Explanations for the chart:
Support and Resistance Levels are the levels that serve as targets when buying or selling the pair. You can place Take Profit near these levels.
Kijun-sen and Senkou Span B lines are lines of the Ichimoku indicator transferred to the hourly timeframe from the 4-hour one.
Support and resistance areas are areas from which the price has repeatedly rebounded off.
Yellow lines are trend lines, trend channels and any other technical patterns.
Indicator 1 on the COT charts is the size of the net position of each category of traders.
Indicator 2 on the COT charts is the size of the net position for the non-commercial group.


