empty
29.01.2022 03:08 PM
EUR/USD analysis on January 29. Results of the month. The dollar has made another breakthrough, but wave C is nearing its end.

This image is no longer relevant

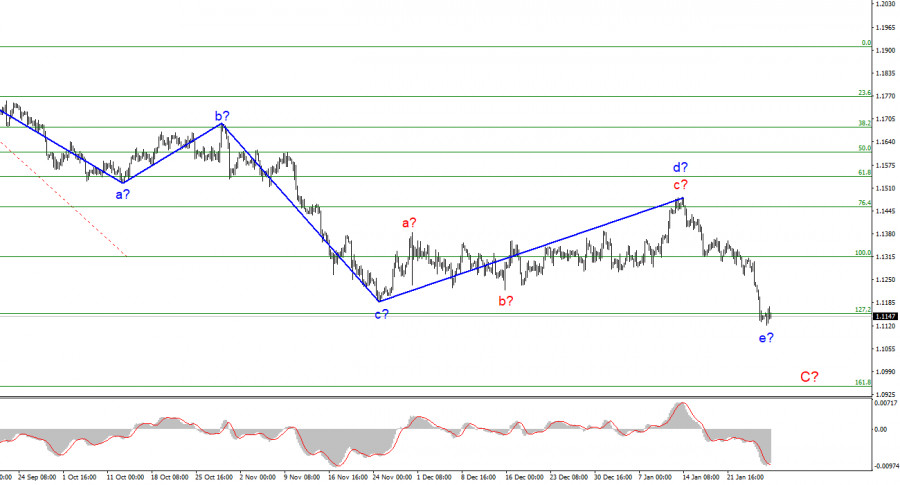
The wave marking of the 4-hour chart for the euro/dollar instrument still looks convincing. Wave d turned out to be more extended than I originally expected, but this does not change the essence of the wave marking. The decline in the quotes of the instrument in the last two weeks has led to the fact that the low of the wave c-C has been broken, so the current descending wave is already quite definitely the wave e-C, as I assumed earlier. Consequently, the entire wave C has assumed a five-wave form, and no internal waves are visible inside its wave e yet. Thus, this wave can also take either a pronounced five-wave form, or vice versa shortened. And in the second case, it is already nearing its completion. A successful attempt to break through the 1.1152 mark, which corresponds to 127.2% Fibonacci, will indicate that the market is ready to sell the instrument. But I admit that in the next week or two this wave may come to an end.

Are there any prospects for further growth in the dollar?

In the second half of the month, the instrument decreased by 360 basis points. After such a strong decline, I would expect to see at least an internal correction wave in the composition of e-C. However, the current wave marking is such that this wave may not be. Wave e can end very quickly and abruptly, and after it, the construction of either a new upward trend segment or a global wave D should begin, which will again be corrective. And this means that it can turn out to be of any length, three-wave, five-wave, and so on. In general, in almost any case, after the completion of wave C, I expect a certain increase in the instrument, but in global terms, it may not be so strong, in the area of 15-17 figures. The news background in January was not the strongest. The Nonfarm Payrolls report in the US turned out to be weak, inflation continued to rise and is already 7%, and the Fed announced its readiness to raise the interest rate, fully complete the QE program in March, and in the summer, perhaps, start selling off bonds that have accumulated on its balance sheet. All this may keep the demand for the US currency high in the coming months and even years. The Fed is going to normalize monetary policy next year, too. And, since we are currently building a correction section of the trend (waves A-B-C), then it can turn out to be much longer and more complicated than it is now. I would say that it is quite possible to continue its construction for most of 2022.

General conclusions.

Based on the analysis, I conclude that the construction of the ascending wave d is completed. Now, it is necessary to sell the instrument based on the construction of the wave e-C with targets located near the estimated mark of 1.0948, which equates to 161.8% Fibonacci. An unsuccessful attempt to break through the 1.1152 mark may lead to the construction of an upward correction wave in the composition of e-C.

This image is no longer relevant

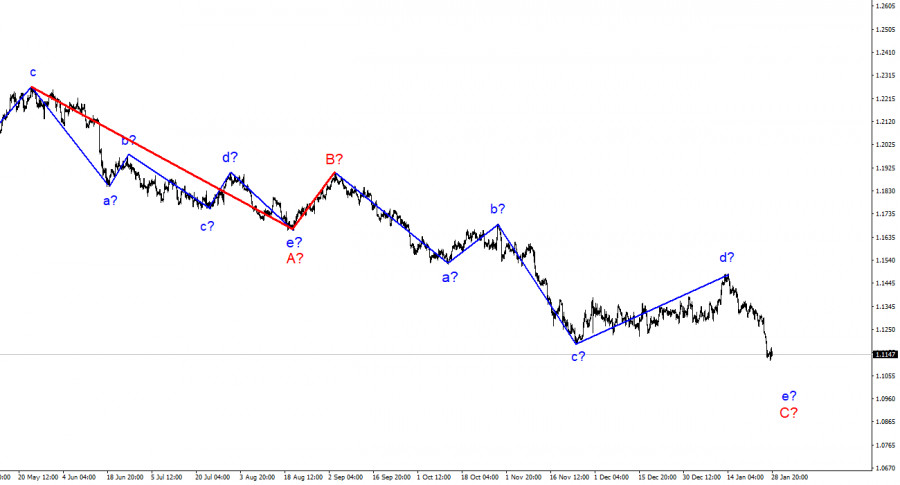
On a larger scale, it can be seen that the construction of the proposed wave e-C is now continuing. This wave may turn out to be a five-wave, or it may be shortened. Considering that all the previous waves were not too large and were approximately the same size, the same can be expected from the current wave. I think there is a better chance that this wave will complete its construction soon.

Chin Zhao,
Analytical expert of InstaForex
© 2007-2025
选择时间框架
5
分钟
15
分钟
30
分钟
1
小时
4
小时
1
1
通过InstaForex赚取加密货币汇率变动的收益。
下载MetaTrader 4并开启您的第一笔交易。
  • Grand Choice
    Contest by
    InstaForex
    InstaForex always strives to help you
    fulfill your biggest dreams.
    JOIN CONTEST

推荐文章

2025年6月2日的歐元/美元分析

在4小時圖上,歐元兌美元的波浪結構已轉變為看漲形態,並繼續保持該形態。我認為這一轉變毫無疑問是由於新的美國貿易政策所引起的。

Chin Zhao 19:07 2025-06-02 UTC+2

2025年6月2日英鎊/美元分析

英鎊/美元的波浪結構持續顯示出一個看漲的衝動波浪模式。此波浪模式與歐元/美元的走勢非常相似。

Chin Zhao 19:05 2025-06-02 UTC+2

基於6月2日簡化波浪分析的GBP/USD、AUD/USD、USD/CHF、EUR/JPY、EUR/GBP和美元指數每週預測

分析: 自四月以來,英鎊的主要上升波段正在發展其最後的 (C) 部分。該波段以衝擊波的形式形成,目前尚無完成的跡象。

Isabel Clark 11:53 2025-06-02 UTC+2

基於簡化波浪分析的 EUR/USD、USD/JPY、GBP/JPY、USD/CAD、NZD/USD 和黃金的每週預測 - 6月2日

分析: 自今年二月以來,歐元的價格走勢一直處於上升波段。自4月11日以來的下跌部分目前缺乏反轉潛力,仍處於趨勢的修正階段。

Isabel Clark 11:48 2025-06-02 UTC+2

2025年5月30日英鎊/美元分析

GBP/USD的波浪結構繼續表明正在發展上行衝動波浪型態。其波浪型態幾乎與EUR/USD相同。

Chin Zhao 17:31 2025-05-30 UTC+2

2025年5月29日歐元/美元分析

在歐元/美元的4小時圖表上,波浪形態已經轉變為上升結構,並且持續如此。很明顯,這種轉變完全是由於美國新貿易政策的影響。

Chin Zhao 20:18 2025-05-29 UTC+2

2025年5月29日英鎊/美元分析

英鎊/美元貨幣對的波浪結構繼續表明多頭衝動波浪形態的形成。這一波浪配置與歐元/美元的波浪形態非常相似。

Chin Zhao 20:17 2025-05-29 UTC+2

2025年5月28日EUR/USD分析

在四小時的歐元/美元走勢圖中,波浪結構已轉變為看漲型態,並持續沿著這個軌跡發展。毫無疑問,這一轉變完全是由新的美國貿易政策所驅動。

Chin Zhao 19:08 2025-05-28 UTC+2

2025年5月27日 EUR/USD 分析

在4小時圖上,歐元/美元的波浪形態已經轉變為看漲結構並保持這種形式。我相信這一變化明顯是由於美國新貿易政策的影響。

Chin Zhao 20:47 2025-05-27 UTC+2

GBP/USD 2025年5月27日分析

GBP/USD的波浪結構繼續指示著一個看漲的衝動波浪型態的形成。這一波浪設置幾乎與EUR/USD相同。

Chin Zhao 20:30 2025-05-27 UTC+2
现在无法通话?
提出您的问题,用 在线帮助.
Widget callback
 

Dear visitor,

Your IP address shows that you are currently located in the USA. If you are a resident of the United States, you are prohibited from using the services of InstaFintech Group including online trading, online transfers, deposit/withdrawal of funds, etc.

If you think you are seeing this message by mistake and your location is not the US, kindly proceed to the website. Otherwise, you must leave the website in order to comply with government restrictions.

Why does your IP address show your location as the USA?

  • - you are using a VPN provided by a hosting company based in the United States;
  • - your IP does not have proper WHOIS records;
  • - an error occurred in the WHOIS geolocation database.

Please confirm whether you are a US resident or not by clicking the relevant button below. If you choose the wrong option, being a US resident, you will not be able to open an account with InstaForex anyway.

We are sorry for any inconvenience caused by this message.