Here are the details of the economic calendar for February 2:
Eurozone's inflation has set a new record. So, the growth of consumer prices in January in annual terms accelerated to 5.1%, while it was forecasted to decline to 4.5%. The current indicator is the maximum value since the beginning of the department's reporting.
Against this background, speculators continued to increase the volume of long positions in the euro, which led to a price increase.
The ADP report on US employment was published during the American trading session, where we saw a decrease for the first time since December 2020. Here, employment in January fell by 301 thousand against the expected growth of 207 thousand. The indicator is very bad, so the market stood still in disbelief when the report was announced.
Analysis of trading charts from February 2:
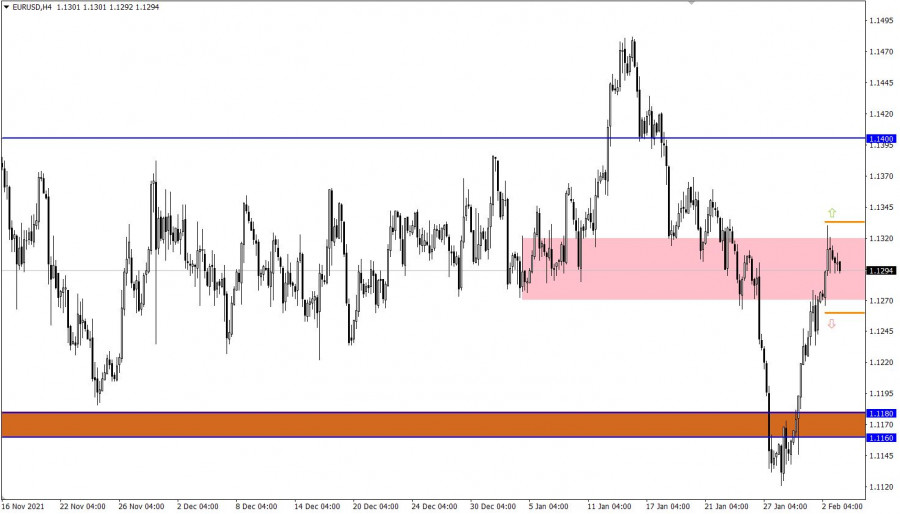
The EUR/USD pair strengthened by 200 points during the correction. This led to a price reversal to the resistance area of 1.1270/1.1320, where a local reduction in the volume of long positions occurred. But despite such a significant upward trend, the medium-term trend is still down.
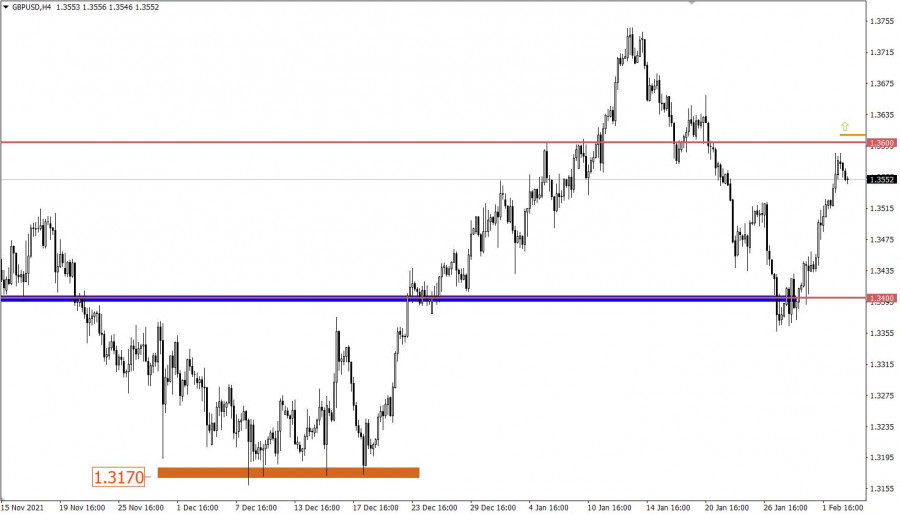
The pound's value strengthened by 220 points for 4 trading days, which led to the convergence of prices with the resistance level of 1.3600. Such a sharp growth is explained by the high interest of traders in speculative operations due to informational noise.
On the daily chart, there was a signal earlier about a gradual recovery of downward interest. Due to the prolonged correction, the signal may turn out to be false if the quote remains above the level of 1.3600.
February 3 economic calendar:
Today is the busiest day of the week, as two meetings of the Central Banks are expected at once.
The Bank of England intends to accelerate the pace of tightening monetary policy by raising the refinancing rate from 0.25% to 0.50%. This step will definitely affect the exchange rate of the British currency in terms of its further strengthening. It is worth considering that the pound has already grown by 200 points, after the news appeared on January 28 that the regulator intends to raise the rate once again. Thus, there is an assumption that the market has already considered the decision of the Bank of England in the quotation.
Following the meeting, the European Central Bank (ECB) is highly likely to leave everything as it is. Therefore, market participants will pay attention to subsequent comments, where we expect to hear specifics from the regulator in terms of further actions. In simple words, the ECB intends to adhere to an ultra-soft approach or follow the path of its colleagues and start tightening monetary policy. The first option of development will lead to a weakening of the euro, but the announcement of an early tightening of monetary policy will provide an opportunity to strengthen the euro noticeably.
Time targeting
Bank of England results - 12:00 Universal time
ECB results - 12:45 Universal time
ECB press conference - 13:30 Universal time
Trading plan for EUR/USD on Feb 3:
In this situation, traders are considering a temporary price fluctuation within the resistance area of 1.1270/1.1320, but everything can change if new speculative surges amid informational noise.
Trading recommendations remain the same, where acceleration is considered after the breakdown of one of the control values.
The signal for the prolongation of the upward cycle will be received if the price holds above the level of 1.1330 in an H4 period.
The signal about the end of the correction will be considered by traders if the price holds below the level of 1.1260 in an H4 period.
Trading plan for GBP/USD on Feb 3:
In this case, there is overheating of long positions, where the level of 1.3600 can act as resistance. This will lead to a gradual recovery of downward interest. It is worth considering that traders might ignore the overbought status due to upcoming events. In this case, holding the price above the level of 1.3600 will lead to a subsequent growth.
What is reflected in the trading charts?
A candlestick chart view is graphical rectangles of white and black light, with sticks on top and bottom. When analyzing each candle in detail, you will see its characteristics of a relative period: the opening price, closing price, and maximum and minimum prices.
Horizontal levels are price coordinates, relative to which a stop or a price reversal may occur. These levels are called support and resistance in the market.
Circles and rectangles are highlighted examples where the price of the story unfolded. This color selection indicates horizontal lines that may put pressure on the quote in the future.
The up/down arrows are the reference points of the possible price direction in the future.


