GBP/USD 5M
The GBP/USD currency pair was trading on Friday in such a way that it is quite difficult to describe it in words. There was no clear trend, constant rollbacks and corrections, constant change of direction of movement, periods of sharp increase in activity. Despite the fact that data on GDP and industrial production were published in the UK this morning, they did not add any clarity to the current technical picture. If on a monthly basis GDP decreased by 0.2% in December, which is better than the forecast, then on a quarterly basis it grew by 1.0%, which is worse than the forecast. And it is unclear as to how we should interpret this data. The report on industrial production turned out to be slightly better than the minimum forecast. As a result, the pound began to rise in price after these statistics, but it did so slowly and with uncertainty that there are serious doubts that traders worked out these reports at all.
Chaos began at the US trading session. The price jumped from side to side and ignored both important levels and the critical Kijun-sen line. The technical picture on the hourly TF is perfectly visible (chart below). In general, the pound is now in absolute chaos, in all timeframes. This point should be taken into account in trading the pair.
As for trading signals, they were as complex and ambiguous as possible. The levels were located at such a distance from each other that it was difficult to use them in trading. The signals are inaccurate, the movements are pure "swings". As a result, Friday was one of the worst days of the current year. Almost all the signals provoked movement by a maximum of 15-20 points, so it was very difficult to work with them. After two false signals and trades opened on them, it was necessary to leave the market. The question is which of the signals traders worked out, as the picture on the market on Friday changed very quickly.
COT report
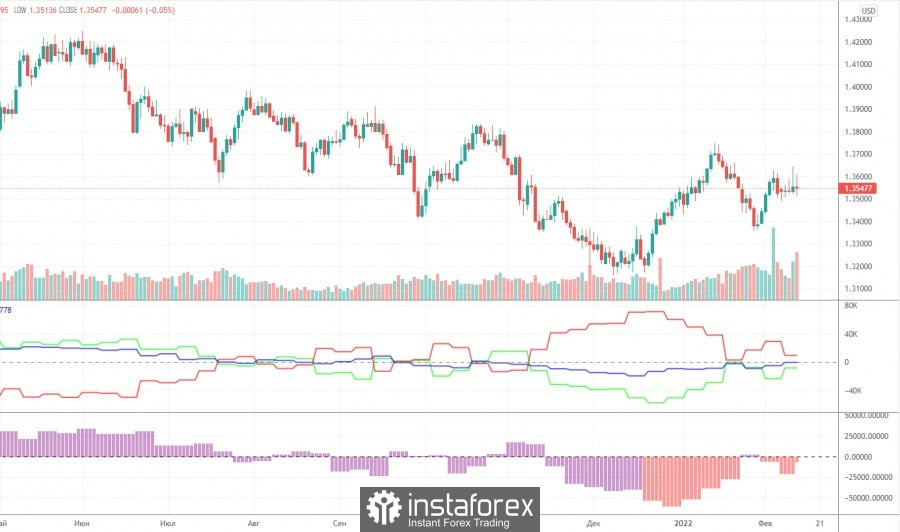
The latest Commitment of Traders (COT) report on the British pound showed a sharp increase in the bullish mood among the "non-commercial" group. During the week, professional traders opened 15,000 long positions and such changes are significant for the pound. It is not surprising that the major players behaved this way last week, since it was then that the Bank of England announced its decision to raise the key rate by 0.25%. However, the overall picture of the state of things provided by the COT reports now speaks of utter uncertainty. Let's start with the fact that even after the net position of large players has grown by 15,000, their mood is called bearish, since the total number of open long positions per pound is less than the total number of open short ones. Moreover, the chart above clearly shows that the green and red lines of the first indicator, which display the net positions of the two most important groups of traders "commercial" and "non-commercial" are now again near zero. And finding the net position indicator near the zero mark means that the number of long and short positions is approximately the same. Moreover, recent changes in net positions do not give grounds to conclude that the trend has ended now or a new one is starting. Roughly speaking, the mood of the players is changing too quickly, so it is impossible to talk about any long-term trends now.
We recommend to familiarize yourself with:
Overview of the EUR/USD pair. February 14. "The music didn't play for long" for the European currency.
Overview of the GBP/USD pair. February 14. Boris Johnson's political career depends on Scotland Yard.
Forecast and trading signals for EUR/USD on February 14. Detailed analysis of the movement of the pair and trading transactions.
GBP/USD 1H
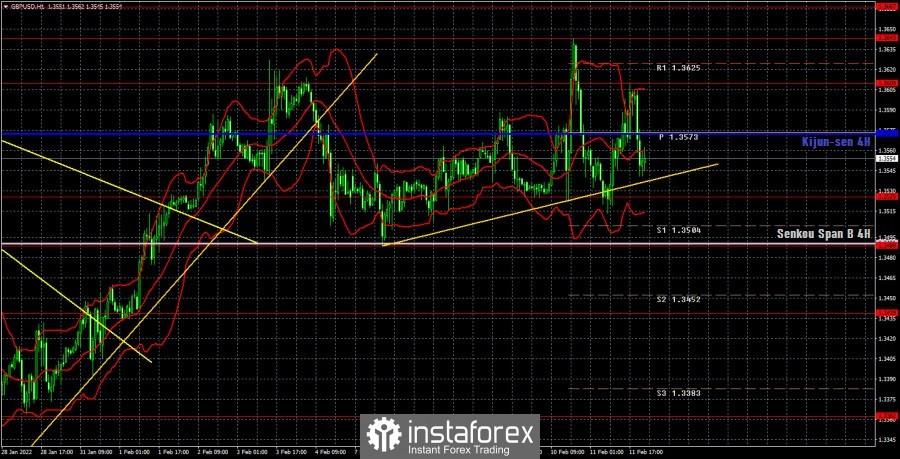
The technical picture on the hourly timeframe is very eloquent. The nature of the movement is clearly visible and does not even require any special explanations. The pair is in "swing" mode and ignores all important lines and levels. Even the trend line, which cannot be called particularly strong, managed to lower the price by 20 points below itself, which cannot be called either a breakthrough or rebound. In general, the situation is extremely complex and ambiguous. We highlight the following important levels on February 14: 1.3439, 1.3489, 1.3525, 1.3609, 1.3643. The Senkou Span B (1.3491) and Kijun-sen (1.3572) lines can also be signal sources. Signals can be "bounces" and "breakthroughs" of these levels and lines. It is recommended to set the Stop Loss level to breakeven when the price passes in the right direction by 20 points. The lines of the Ichimoku indicator can move during the day, which should be taken into account when determining trading signals. There are also support and resistance levels on the chart that can be used to take profits on transactions. No important events are scheduled for Monday in the UK and the US again. Nevertheless, the whole world will be watching "geopolitics", which can provoke serious movements. Especially in the US trading session.
Explanations for the chart:
Support and Resistance Levels are the levels that serve as targets when buying or selling the pair. You can place Take Profit near these levels.
Kijun-sen and Senkou Span B lines are lines of the Ichimoku indicator transferred to the hourly timeframe from the 4-hour one.
Support and resistance areas are areas from which the price has repeatedly rebounded off.
Yellow lines are trend lines, trend channels and any other technical patterns.
Indicator 1 on the COT charts is the size of the net position of each category of traders.
Indicator 2 on the COT charts is the size of the net position for the non-commercial group.


