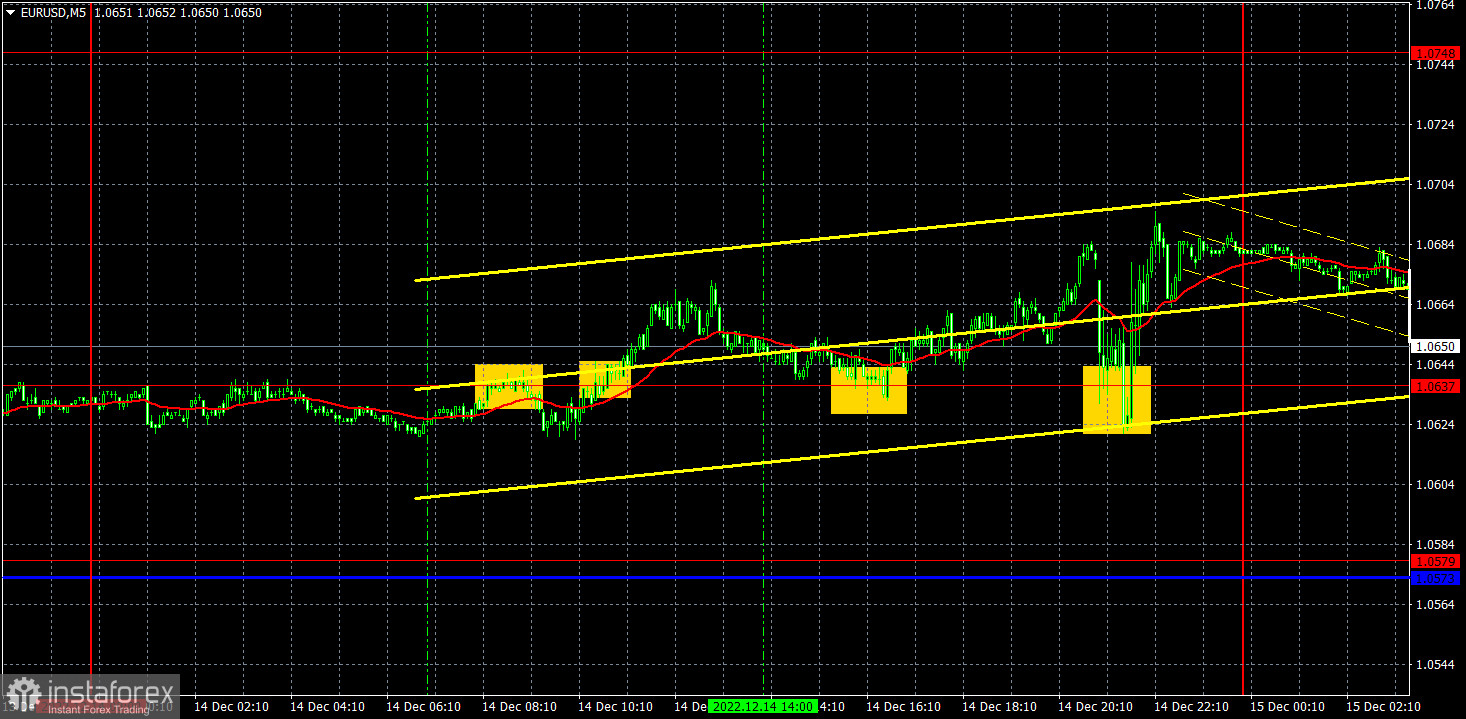
Analysis of EUR/USD, 5M
On Wednesday, the euro/dollar pair was showing low volatility until the publication of the FOMC meeting results. When the Fed announced its decision on the 0.5% key rate hike, the US dollar jumped, but then lost all the gains. Thus, at the end of the day, the pair was trading at almost the same levels. It is highly possible that traders priced in such an outcome long ago.
At the press conference, Jerome Powell said that the regulator would raise the benchmark rate until they saw a trend toward 2% inflation. According to the recent forecast, in 2023, the key rate may reach 5.1%. There is no wonder since no one believed that the interest rate hike in December was the last one. Thus, neither Powell nor the Fed surprised traders. We saw an ordinary reaction of the market in the form of jumps and slumps. All trading signals of the day were formed near the level of 1.0637. Since until the evening, the pair was trading flat, all the signals turned out to be false. That is why traders could use just the first two signals. A sell signal was so weak that the price failed to drop by even 15 pips. The trade was closed with losses. A buy signal was slightly better. The pair climbed by 15 pips. The trade was closed at breakeven.
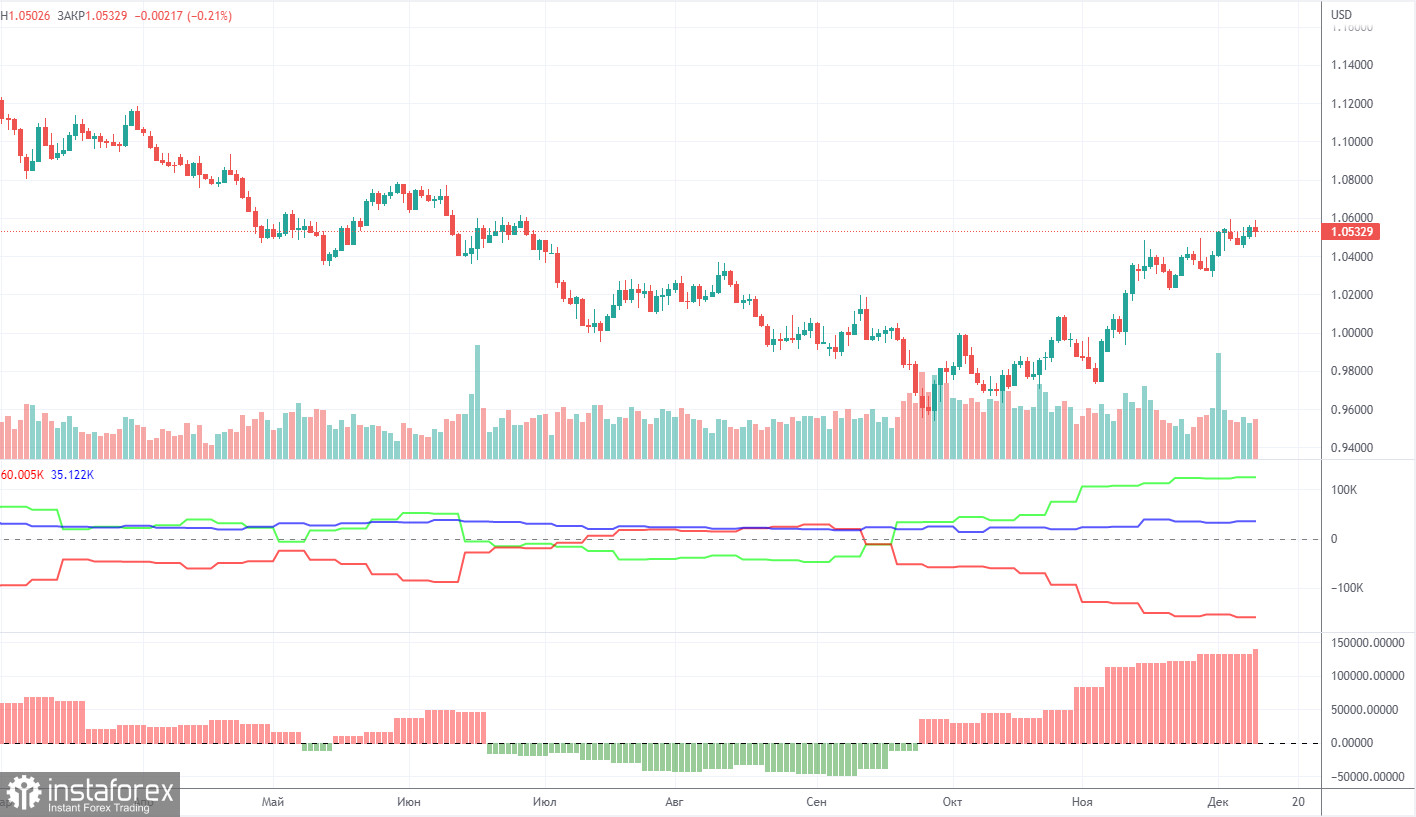
COT report
In 2022, the COT reports for the euro are becoming more and more interesting. In the first part of the year, the reports were pointing to the bullish sentiment among professional traders. However, the euro was confidently losing value. Then, for several months, reports were reflecting bearish sentiment and the euro was also falling. Now the net position of non-commercial traders is again bullish and strengthens almost every week. The euro is growing, but a fairly high value of the net position may point to the end of the upward movement or at least, to a correction. During the given period, the number of buy contracts opened by non-commercial traders increased by 3.9 thousand, whereas the number of short contracts rose by 1.3 thousand. Thus, the net positions advanced by 2.6 thousand. Notably, the green and red lines of the first indicator have moved far apart from each other, which may mean the end of the ascending trend. The number of buy contracts is 125 thousand higher than the number of sell contracts opened by non-commercial traders. Thus, the net position of the non-commercial group may continue to grow. However, the euro may remain unchanged. The overall number of short orders exceeds the number of long orders by 35 thousand (661k vs. 626k).
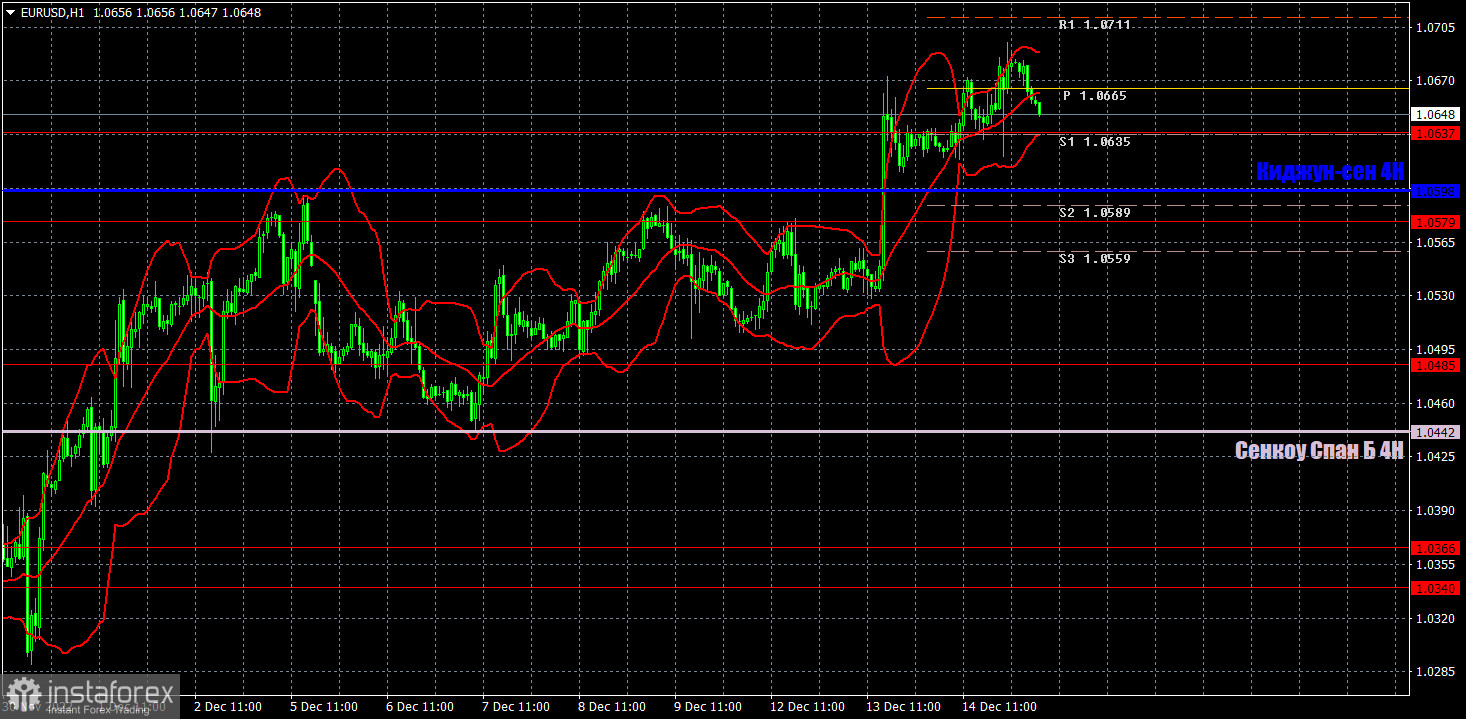
Analysis of EUR/USD, 1H
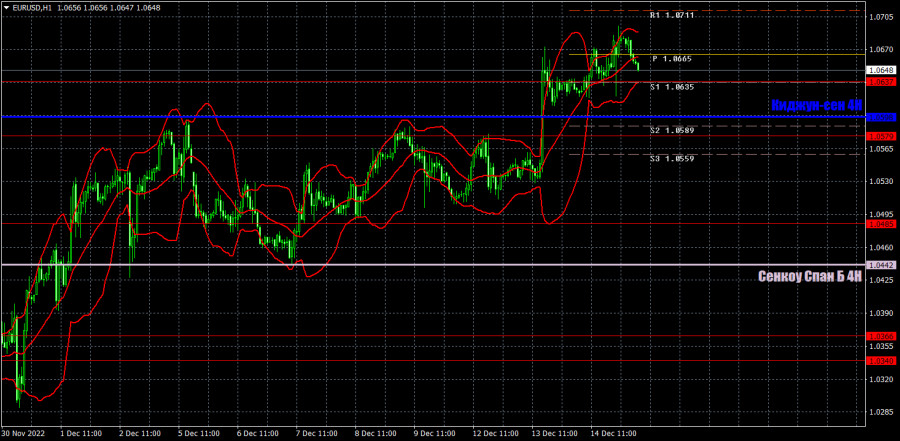
On the one-hour chart, the euro/dollar pair continues trading very high. The Fed's meeting and the speech provided by Jerome Powell failed to support the US dollar. Although some traders still believe that the downward correction is in force, there is no sell signal or sign of a deep correction. On Thursday, traders should be focused on the following levels: 1.0340-1.0366, 1.0485, 1.0579, 1.0637, 1.0765, 1.0806, as well as the Senkou Span B (1.0442) and Kijun-sen (1.0598) lines. The lines of the Ichimoku indicator can move during the day, which should be taken into account when determining trading signals. Breakouts and rebounds from these levels could be used as signals. Do not forget to place a stop-loss order at breakeven if the price goes in the right direction by 15 pips. This will protect against possible losses if the signal turns out to be false. On December 15, the results of the ECB meeting will be announced in the European Union. In addition, the US will publish data on industrial production and retail sales. We expected strong movements and dollar growth from this week, but so far, we have not seen any of this. The ECB meeting is certainly important, but the market reaction could be the same as yesterday.
What we see on the trading charts:
Price levels of support and resistance are thick red lines, near which the movement may end. They do not provide trading signals.
The Kijun-sen and Senkou Span B lines are the lines of the Ichimoku indicator, moved to the one-hour chart from the 4-hour one. They are strong lines.
Extreme levels are thin red lines from which the price bounced earlier. They provide trading signals.
Yellow lines are trend lines, trend channels, and any other technical patterns.
Indicator 1 on the COT charts reflects the net position size of each category of traders.
Indicator 2 on the COT charts reflects the net position size for the non-commercial group.