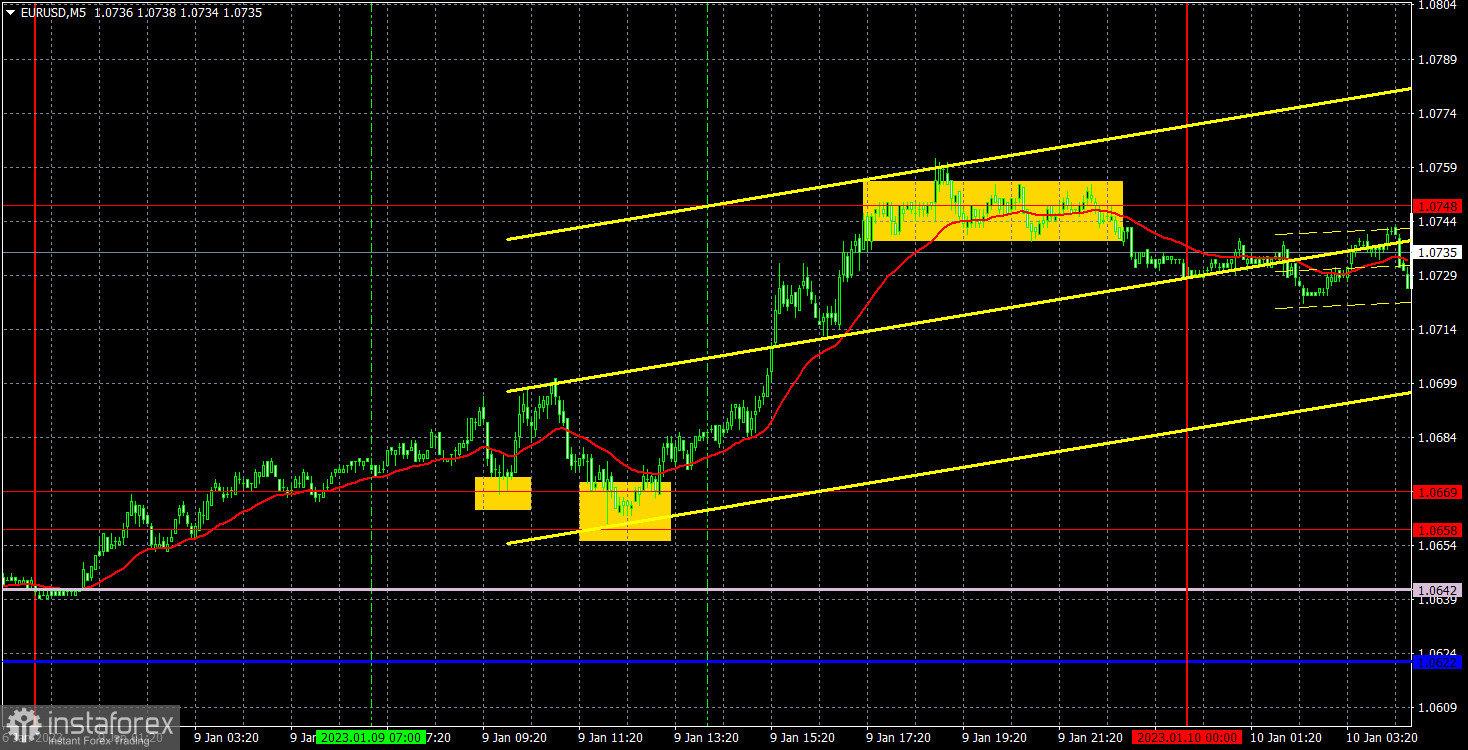
M5 chart of EUR/USD
On Monday, EUR/USD continued its upward movement, but this is due to the reports from last Friday. Yesterday, there were no important events in the EU and the US, but on Friday there were many of them. We already mentioned in our fundamental articles that the market had an illogical reaction to all the data, but over the past few months we might have even gotten used to this. So I don't have to repeat myself, let's just say that the market is still using any reason to buy the euro, and there is still no bearish correction in sight. That is why in the near future, it would be wise to expect the euro's growth, even if the fundamental or macroeconomic background is in favor of the dollar. For example, Federal Reserve Chairman Jerome Powell will give a speech today. There is no doubt that he might provide some dovish hints, which might be enough for the euro to rise, even if he also shows a hawkish stance.
Speaking of trading signals, yesterday's situation was almost perfect. During the European trading session, the price rebounded from the area of 1.0658-1.0669 twice. In the first case, the pair managed to go up only 16 pips, so the trade closed at Stop Loss at breakeven. The second time, the price managed to rise to 1.0748, where the profit on the long position should have been locked in - 65 pips.
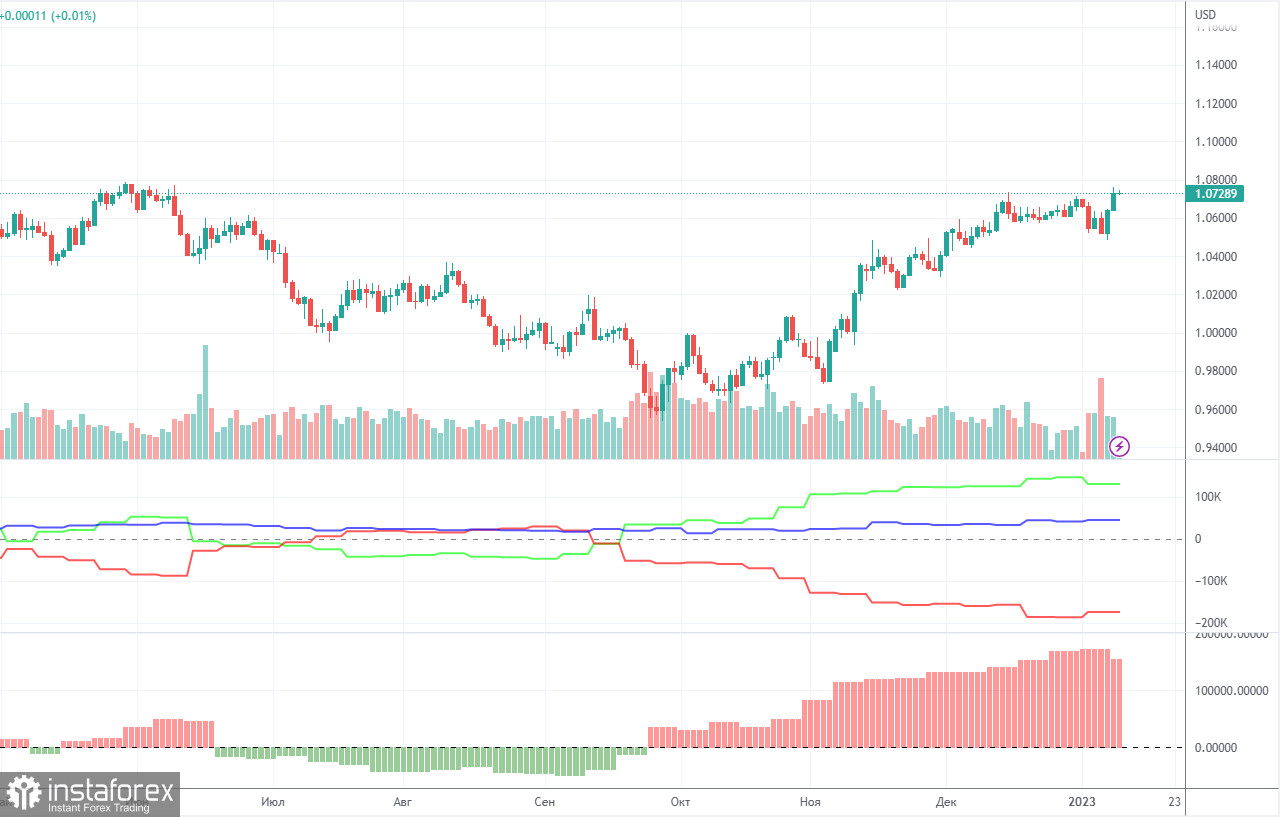
COT report
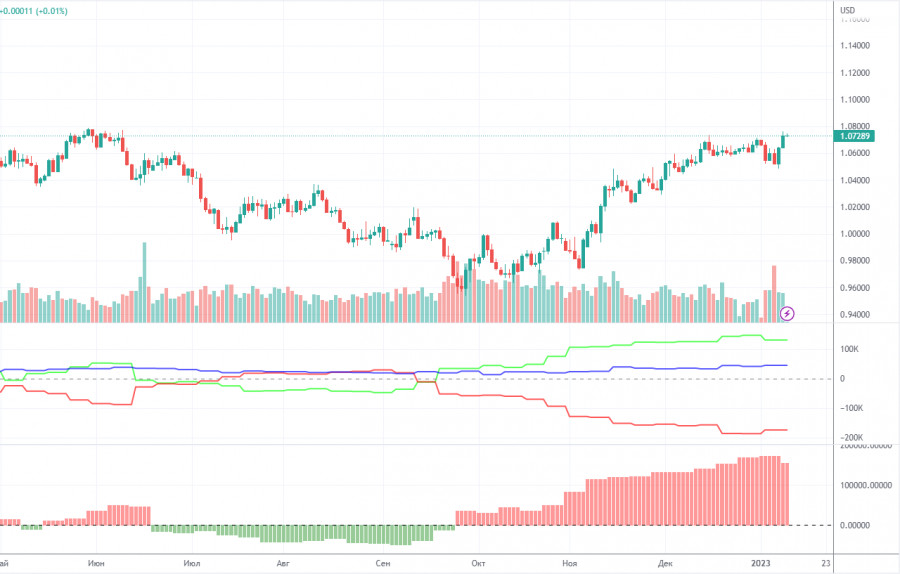
The COT reports for the euro in the last few months have been fully consistent with what is happening in the market. You can clearly see on the chart that the net position of big players (the second indicator) has been growing since early September. Around the same time, the euro started to grow. At this time, the net position of the non-commercial traders has been bullish and strengthens almost every week, but it is a rather high value that allows us to assume that the upward movement will end soon. Notably, the green and red lines of the first indicator have moved far apart from each other, which often means the end of the trend. During the given period, the number of long positions held by non-commercial traders decreased by 29,300, whereas the number of short positions fell by 13,100. Thus, the net positions decreased by 16,200. The number of long positions is 130,000 higher than the number of short positions opened by non-commercial traders. So the question now is how long will the big players increase their longs? Moreover, from a technical perspective, a bearish correction should have started a long time ago. In my opinion, this process can not continue for another 2 or 3 months. Even the net position indicator shows that we need to "unload" a bit, that is, to correct. The overall number of short orders exceeds the number of long orders by 44,000 (671,000 vs. 627,000).
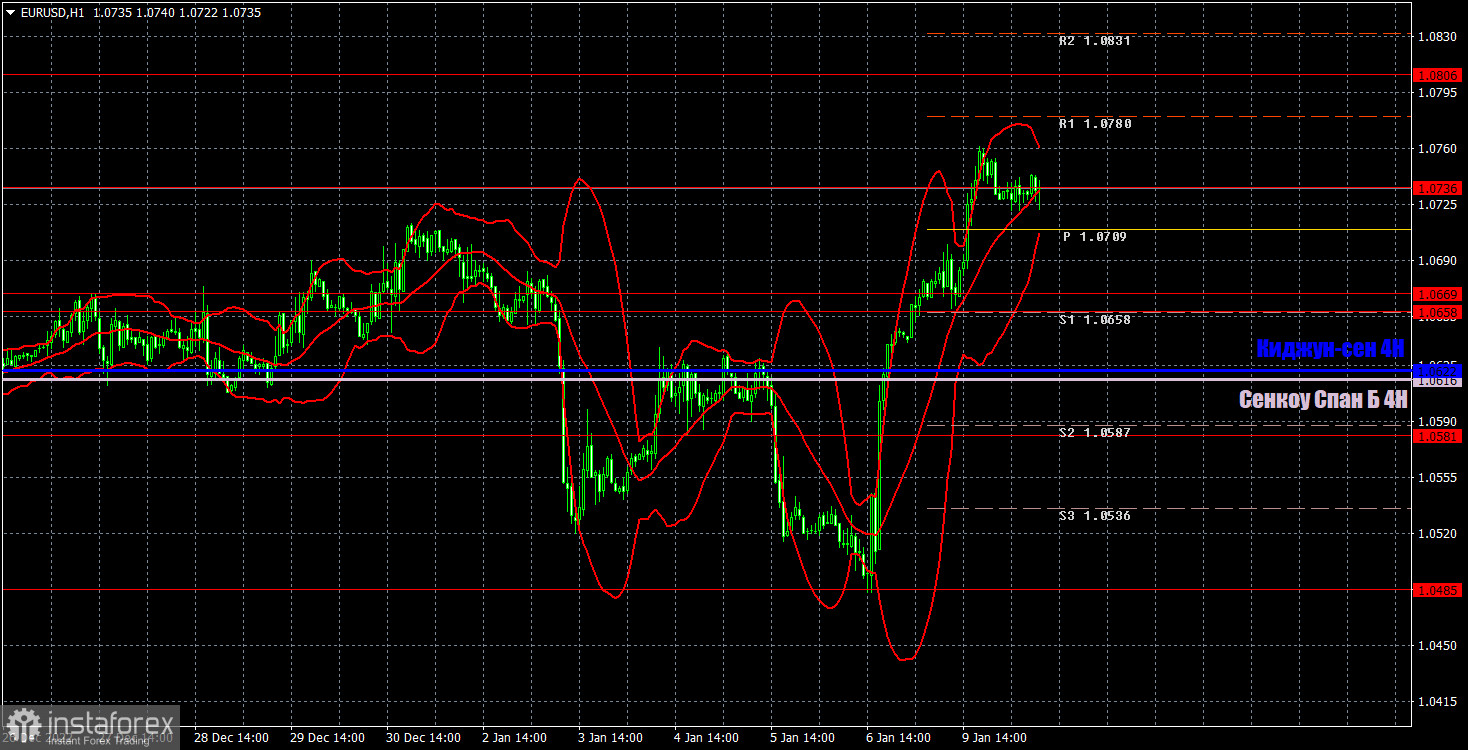
H1 chart of EUR/USD
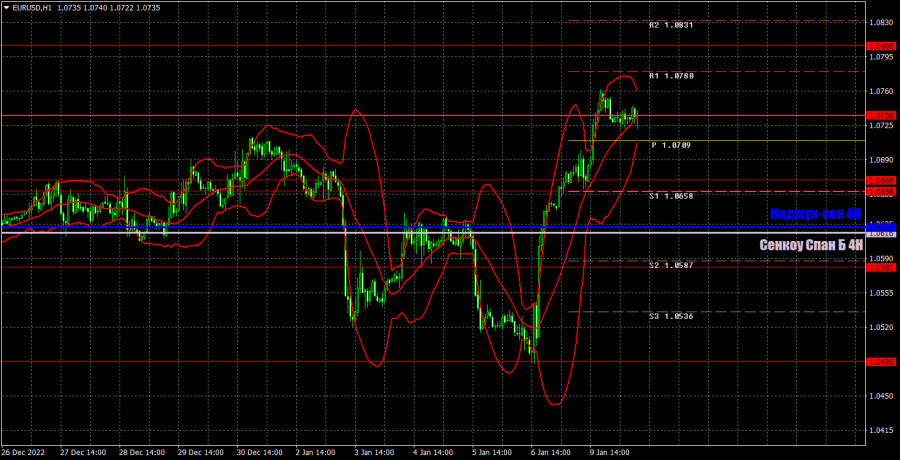
On the one-hour chart, EUR/USD has once again consolidated above the lines of the Ichimoku indicator. Theoretically, it could indicate the start of a "swing" movement on the higher chart, but on the lower chart it appears to be an attempt to resume the upward movement, despite the absence of the appropriate fundamental and macroeconomic background. For now we are set on going long, but then again there is also a high probability of decline. On Tuesday, the pair may trade at the following levels: 1.0269, 1.0340-1.0366, 1.0485, 1.0581, 1.0658-1.0669, 1.0736, 1.0806, 1.0938, 1.1036, and also Senkou Span B (1.0616) and Kijun Sen (1.0622). Lines of the Ichimoku indicator may move during the day, which should be taken into account when determining trading signals. There are also support and resistance levels, but signals are not formed near these levels. Bounces and breakouts of the extreme levels and lines could act as signals. Don't forget about stop-loss orders, if the price covers 15 pips in the right direction. This will prevent you from losses in case of a false signal. On January 10, Powell will speak in the US and there are no other important events or reports scheduled for today. However, even Powell's speech might provoke a strong market reaction.
What we see on the trading charts:
Price levels of support and resistance are thick red lines, near which the movement may end. They do not provide trading signals.
The Kijun-sen and Senkou Span B lines are the lines of the Ichimoku indicator, moved to the one-hour chart from the 4-hour one. They are strong lines.
Extreme levels are thin red lines from which the price bounced earlier. They provide trading signals.
Yellow lines are trend lines, trend channels, and any other technical patterns.
Indicator 1 on the COT charts reflects the net position size of each category of traders.
Indicator 2 on the COT charts reflects the net position size for the non-commercial group.