M5 chart of EUR/USD
On Tuesday, EUR/USD froze in place. The price moved sideways all day, staying near its local highs. The pair last grew on Friday, when crucial data on the labor market, unemployment and business activity were released in the US. The market, as it has been doing lately, treated this data one-sidedly, just ignoring any positive information for the dollar. And when the upward momentum dried up, once again it could not even start a correction. There was only one event yesterday - the speech of Federal Reserve Chairman Jerome Powell, but he did not touch the monetary policy issues in Stockholm, so traders did not get any new information.
There were three trading signals during the day. The price rebounded from 1.0748 every time. And this is just fine, because everything could have been much worse in flat conditions. All three signals turned out to be false, since the price failed to reach the nearest target level or line. Nevertheless, the pair was going down by 15 points, so a Stop Loss should have been set at breakeven on all open trades. Besides, there was no buy signal.
COT report
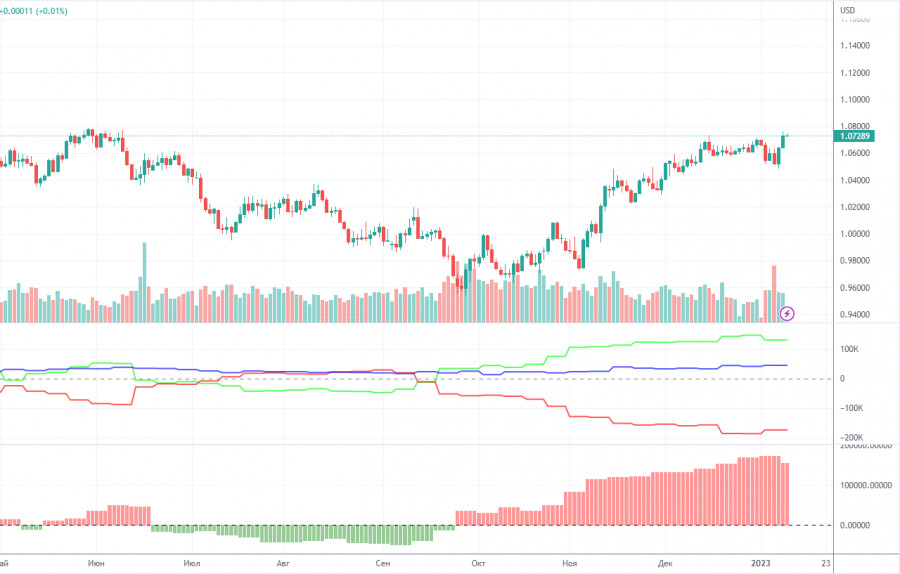
The COT reports for the euro in the last few months have been fully consistent with what is happening in the market. You can clearly see on the chart that the net position of big players (the second indicator) has been growing since early September. Around the same time, the euro started to grow. At this time, the net position of the non-commercial traders has been bullish and strengthens almost every week, but it is a rather high value that allows us to assume that the upward movement will end soon. Notably, the green and red lines of the first indicator have moved far apart from each other, which often means the end of the trend. During the given period, the number of long positions held by non-commercial traders decreased by 29,300, whereas the number of short positions fell by 13,100. Thus, the net positions decreased by 16,200. The number of long positions is 130,000 higher than the number of short positions opened by non-commercial traders. So the question now is how long will the big players increase their longs? Moreover, from a technical perspective, a bearish correction should have started a long time ago. In my opinion, this process can not continue for another 2 or 3 months. Even the net position indicator shows that we need to "unload" a bit, that is, to correct. The overall number of short orders exceeds the number of long orders by 44,000 (671,000 vs. 627,000).
H1 chart of EUR/USD
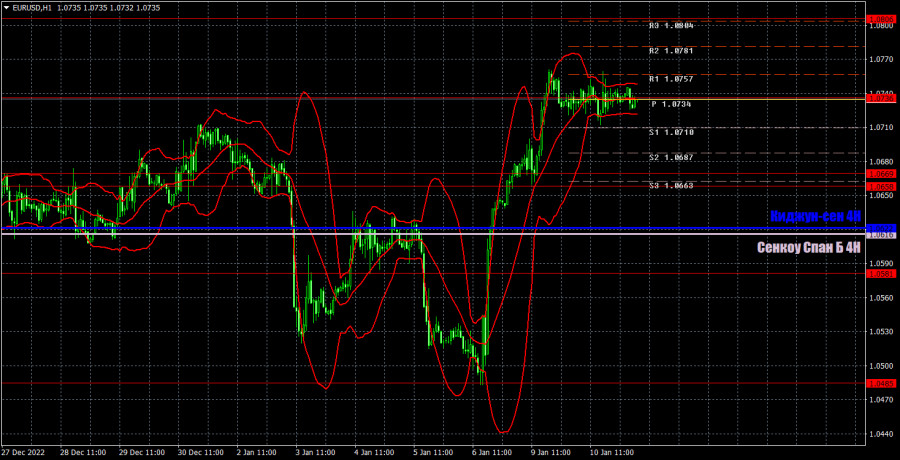
On the one-hour chart, EUR/USD has once again settled above the lines of the Ichimoku indicator. Theoretically, it may mean the beginning of a "swing" movement on the higher chart, but on the lower chart it looks like an attempt to resume the upward movement, despite the absence of the appropriate fundamental and macroeconomic background. For the time being we are set on going long, but there's also a high probability of a decline. On Wednesday, the pair may trade at the following levels: 1.0269, 1.0340-1.0366, 1.0485, 1.0581, 1.0658-1.0669, 1.0736, 1.0806, 1.0938, 1.1036 and also Senkou Span B (1.0616) and Kijun Sen (1.0622). Lines of the Ichimoku indicator may move during the day, which should be taken into account when determining trading signals. There are also support and resistance levels, but signals are not formed near these levels. Bounces and breakouts of the extreme levels and lines could act as signals. Don't forget about stop-loss orders, if the price covers 15 pips in the right direction. This will prevent you from losses in case of a false signal. On January 11, there are no important events or reports planned in the US and the EU, so the flat may persist. Nevertheless, traditionally I expect the euro to fall.
What we see on the trading charts:
Price levels of support and resistance are thick red lines, near which the movement may end. They do not provide trading signals.
The Kijun-sen and Senkou Span B lines are the lines of the Ichimoku indicator, moved to the one-hour chart from the 4-hour one. They are strong lines.
Extreme levels are thin red lines from which the price bounced earlier. They provide trading signals.
Yellow lines are trend lines, trend channels, and any other technical patterns.
Indicator 1 on the COT charts reflects the net position size of each category of traders.
Indicator 2 on the COT charts reflects the net position size for the non-commercial group.


