empty
 
 
13.02.2023 10:20 AM
EUR/USD and GBP/USD: trading plan for beginners on February 13, 2023

Macroeconomic calendar from February 10

UK GDP slowed to 0.4% from 1.9% in the fourth quarter although came slightly better than expected.

On Friday, ECB member Isabel Schnabel responded to journalists' questions. She was asked over 30 questions in total and gave vague answers to questions about interest rates. Clearly, the euro showed weakness because the market expected clearer remarks from the ECB official.

Overview of technical charts from February 10

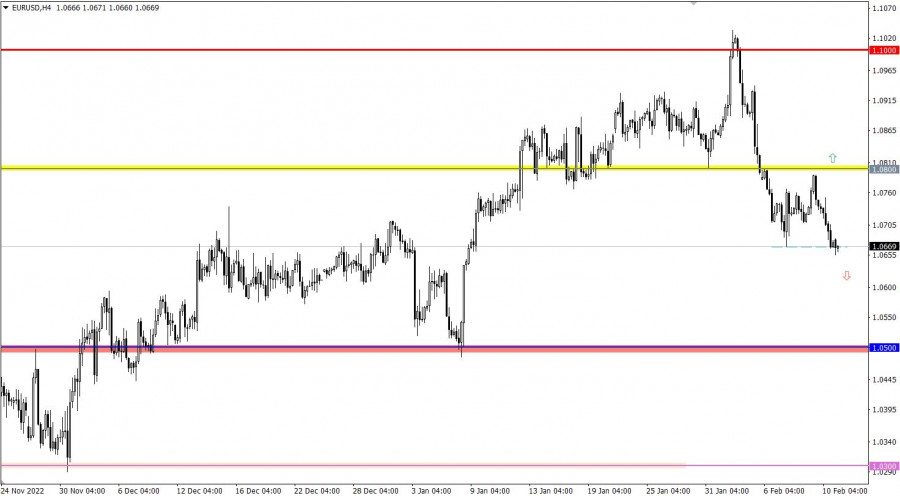
Moving down, EUR/USD hit a new low, and the corrective move went on from the high of the medium-term trend.

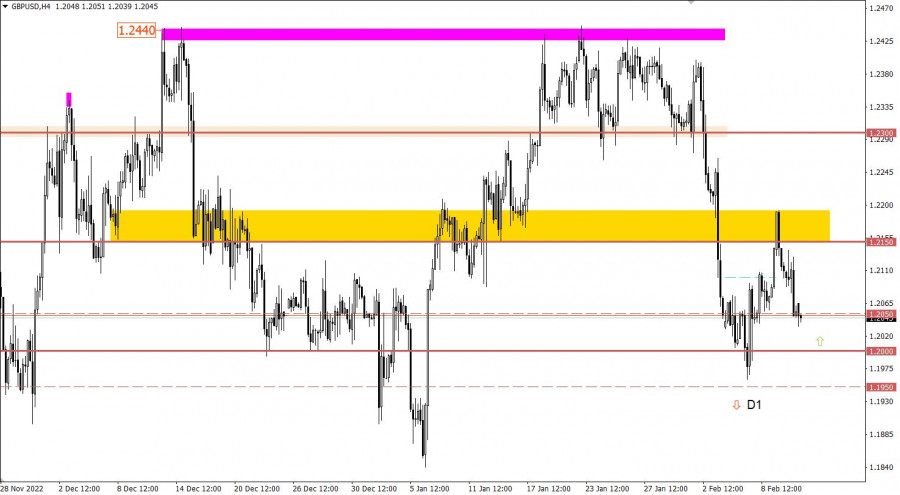
Meanwhile, GBP/USD returned to the psychological level of 1.2000, which indicated the end of the upside cycle at around 1.2150.

This image is no longer relevant

Macroeconomic calendar on February 13

Monday is traditionally an uneventful day in the market, marked by an empty macroeconomic calendar.

Therefore, the news flow will be the main driving force for the quotes today.

Trading plan for EUR/USD on February 13

At this point, consolidation below 1.0650 in the 4-hour time frame at least could cause an increase in selling volumes, which in turn could prolong the corrective move.

Alternatively, if the downtrend cycle slows, the price may retrace and come to a standstill.

This image is no longer relevant

Trading plan for GBP/USD on February 13

Traders will focus on the 1.2000 level. Due to price swings on February 6-7, selling volumes decreased. The 1.2000 mark also serves as support.

We may see a bearish continuation if the price consolidates below 1.1950 in the daily time frame.

This image is no longer relevant

What's on technical charts

The candlestick chart shows graphical white and black rectangles with upward and downward lines. While conducting a detailed analysis of each individual candlestick, it is possible to notice its features intrinsic to a particular time frame: the opening price, the closing price, and the highest and lowest price.

Horizontal levels are price levels, in relation to which a stop or reversal of the price may occur. They are called support and resistance levels.

Circles and rectangles are highlighted examples where the price reversed in the course of its history. This color highlighting indicates horizontal lines which can exert pressure on prices in the future.

Upward/downward arrows signal a possible future price direction.

Gven Podolsky,
Analytical expert of InstaForex
© 2007-2024
通过InstaForex赚取加密货币汇率变动的收益。
下载MetaTrader 4并开启您的第一笔交易。
  • Grand Choice
    Contest by
    InstaForex
    InstaForex always strives to help you
    fulfill your biggest dreams.
    JOIN CONTEST
  • Chancy Deposit
    Deposit your account with $3,000 and get $6000 more!
    In December we raffle $6000 within the Chancy Deposit campaign!
    Get a chance to win by depositing $3,000 to a trading account. Having fulfilled this condition, you become a campaign participant.
    JOIN CONTEST
  • Trade Wise, Win Device
    Top up your account with at least $500, sign up for the contest, and get a chance to win mobile devices.
    JOIN CONTEST
  • 100% Bonus
    Your unique opportunity to get a 100% bonus on your deposit
    GET BONUS
  • 55% Bonus
    Apply for a 55% bonus on your every deposit
    GET BONUS
  • 30% Bonus
    Receive a 30% bonus every time you top up your account
    GET BONUS

推荐文章

现在无法通话?
提出您的问题,用 在线帮助.
Widget callback