Details of the economic calendar on February 14
The U.K. labor market data came out mixed. Unemployment remained at 3.7%, which was in line with the forecast. However, employment in the country grew by 74,000, while jobless claims declined by 12,900. If we disregard the unemployment rate, the UK labor market data came out quite well.
For this reason, the pound sterling has maintained its position in the market.
The second estimate of the Q4 2022 GDP in the eurozone was published, which saw an increase of 1.9% year-on-year and 0.1% quarter-on-quarter.
The figures were fully in line with the preliminary estimate.
The main event was the data on inflation in the United States, which actual figures turned out to be higher than market expectations.
The consumer price index was down to 6.4% in January from 6.5% a month earlier. The market was expecting it to decrease to 6.2%.
Analysis of trading charts from February 14
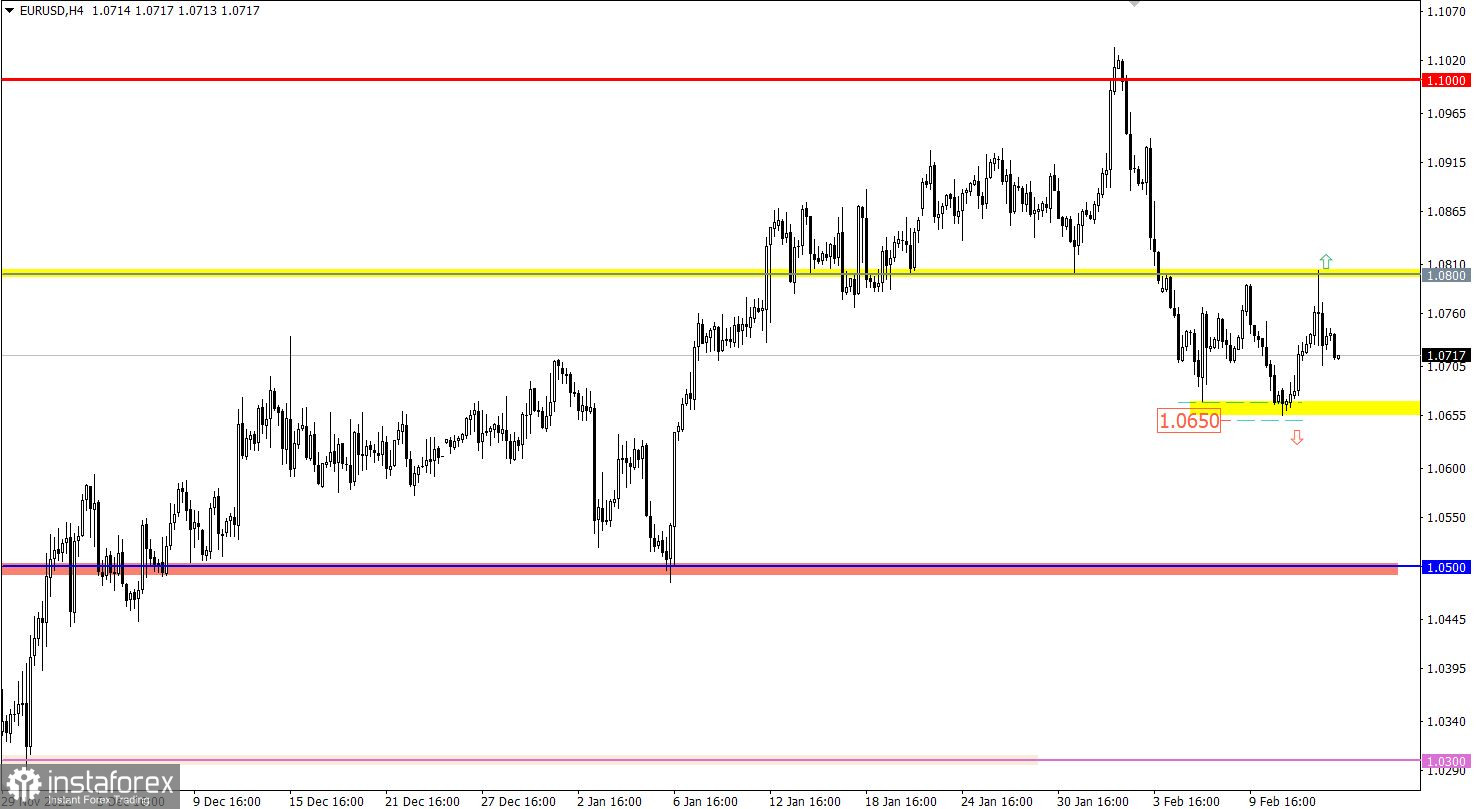
The EURUSD currency pair reached the level of 1.0800, where there was a reduction in the volume of long positions. This led to a rebound in price, accompanied by speculative jumps.
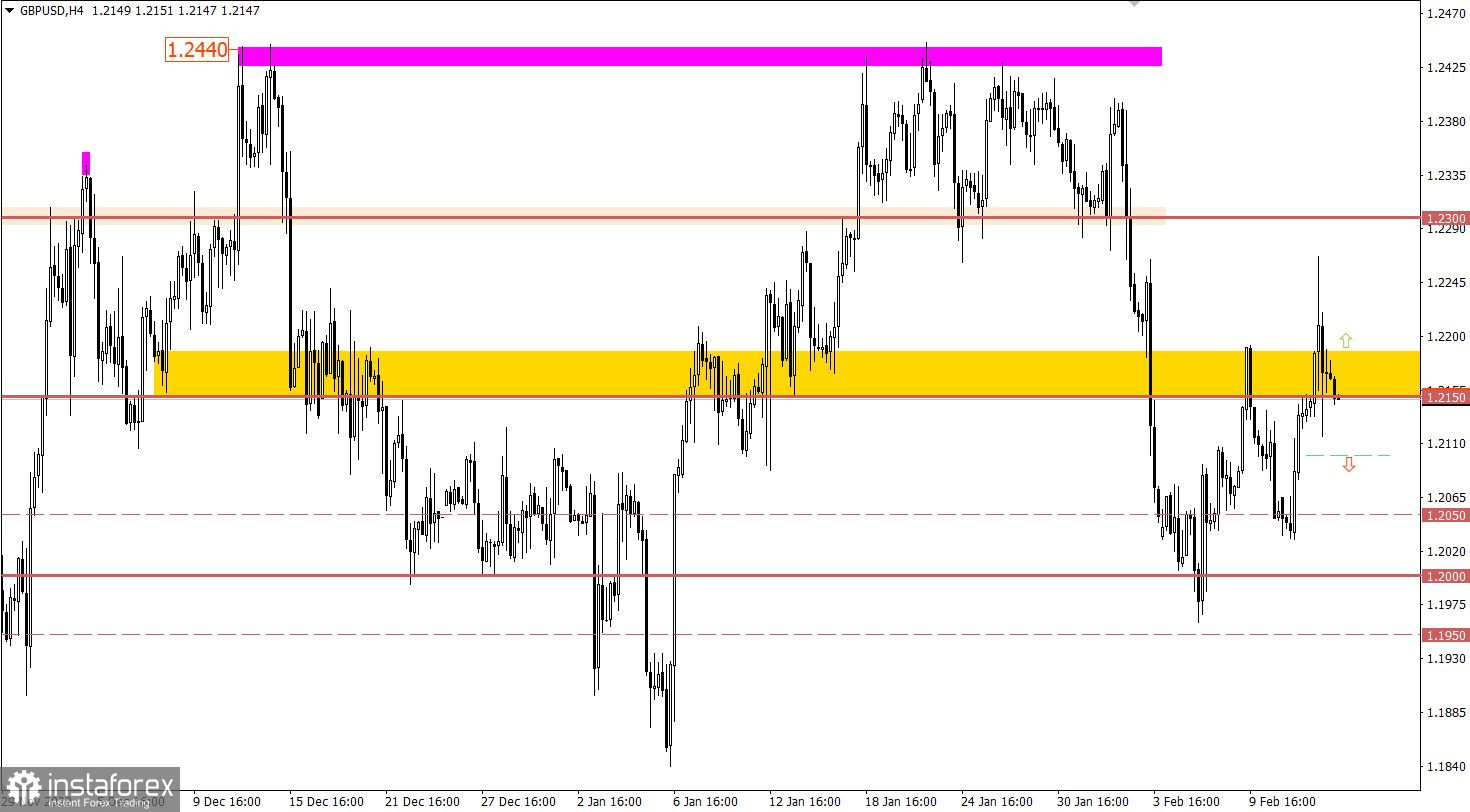
The GBPUSD currency pair managed to jump in value locally to the level of 1.2270. This price move indicated the prevailing upward mood, which was a technical signal of the possible completion of the recent correction. Buyers' joy did not last long, after the upward impulse, a pullback occurred immediately, which subsequently intensified.
Economic calendar for February 15
Today, with the opening of the European session, the UK inflation data were released, which slowed down from 10.5% to 10.1%. This is a positive factor for the economy, given that it was forecasted to slow down to 10.3%.
The pound sterling reacted accordingly—with a decline. This was due to the fact that the Bank of England may soon change the current monetary policy.
The European Union will release its data on industrial production, which is 2.0% at the moment but might give way to a decline of -0.3%. This is negative for the euro if the figures coincide with the forecast.
Data on retail sales in the United States will also be released during the American trading session, the growth rate of which may slow down from 6.0% to 4.5%. The negative for the U.S. will not end there, as along with retail sales data, industrial production figures will be released, the growth rate of which may decrease from 1.6% to 1.1%.
If the forecasts on the U.S. statistics coincide, the dollar may be under selling pressure.
Time targeting:
EU Industrial production – 10:00 UTC
U.S. Retail sales – 13:30 UTC
U.S. Industrial production – 14:15 UTC
EUR/USD trading plan for February 15
Based on the cycle of fluctuations for six trading days, there is a characteristic lateral movement within the boundaries of 1.0670/1.0800. This movement may become a process of accumulation of trading forces, which will eventually lead to an outgoing momentum.
Let's concretize the above:
The downward momentum will be relevant if the price holds below 1.0650 in a four-hour period. This step may lead to the prolongation of the current corrective move.
The upward momentum in the currency pair is taken into account in case of a stable holding of the price above the value of 1.0800 in a four-hour period. This step will indicate the completion of the corrective move.
GBP/USD trading plan for February 15
Due to inflation data, the pound accelerated its decline, which made it possible to fall below the 1.2100 mark. The reason for this reaction in the foreign exchange market was described above. In this situation, stable price retention below the value of 1.2100 may lead to a decline in the area of the 1.2000 psychological level. In this case, the technical signal about the recovery of the value of the pound sterling relative to the correction will be canceled.
As for the alternative view, in order to consider the upward scenario, the quote again needs to return above the level of 1.2150 in a four-hour period.
What's on the charts
The candlestick chart type is white and black graphic rectangles with lines above and below. With a detailed analysis of each individual candle, you can see its characteristics relative to a particular time frame: opening price, closing price, intraday high and low.
Horizontal levels are price coordinates, relative to which a price may stop or reverse its trajectory. In the market, these levels are called support and resistance.
Circles and rectangles are highlighted examples where the price reversed in history. This color highlighting indicates horizontal lines that may put pressure on the asset's price in the future.
The up/down arrows are landmarks of the possible price direction in the future.