empty
 
 
21.02.2023 07:57 AM
EUR/USD: Forecast and trading signals on February 21, 2023. COT report. Detailed analysis of price movement and trades

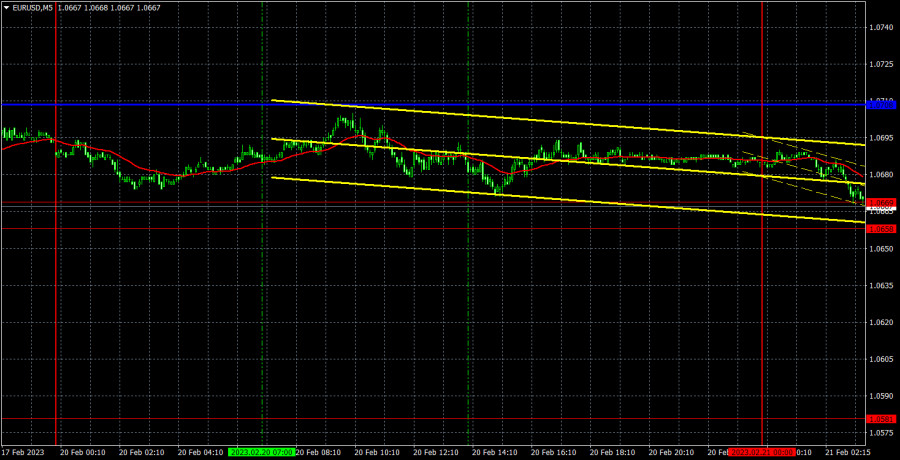
M5 chart of EUR/USD

This image is no longer relevant

On Monday, EUR/USD traded sideways due to the empty macroeconomic calendar. Traders had nothing to pay attention to during the day. Therefore, no trading signals were generated. Nevertheless, the general downtrend remains intact, which means the pair is likely to keep going down this week. Although, it will highly unlikely be a strong movement due to a lack of events during the week. In the best-case scenario, the price will be in the downtrend and with frequent rebounds.

Since no trading signals were produced, trading made no sense yesterday. The pair approached both the 1.0669 mark and the psychological level once. It traded in a 40-pip sideways channel between 1.0669 and 1.0708 during the day.

COT report:

This image is no longer relevant

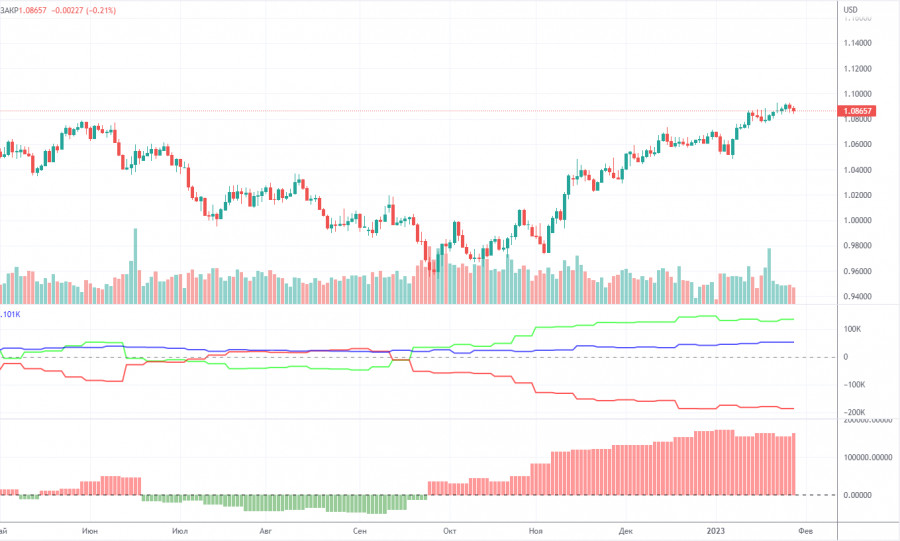
Due to a technical glitch, fresh COT reports have not been released since January 24. Therefore, we can only analyze reports published before this date. The COT reports on EUR/USD have been in line with expectations in recent months. The net non-commercial position has been on the rise since September. The bullish non-commercial position rises with each new week. Taking into account this fact, we may assume that the uptrend will soon come to an end. The red and green lines of the first indicator are far apart, which is usually a sign of the end of a trend. In the reporting week, non-commercial traders opened 9,500 long positions and 2,000 short ones. The net non-commercial position grew by 7,500. The number of long positions exceeds that of short ones by 134,000. In any case, a correction has been looming for a long time. Therefore, even without reports, it is clear that the downtrend will continue.

H1 chart of EUR/USD

This image is no longer relevant

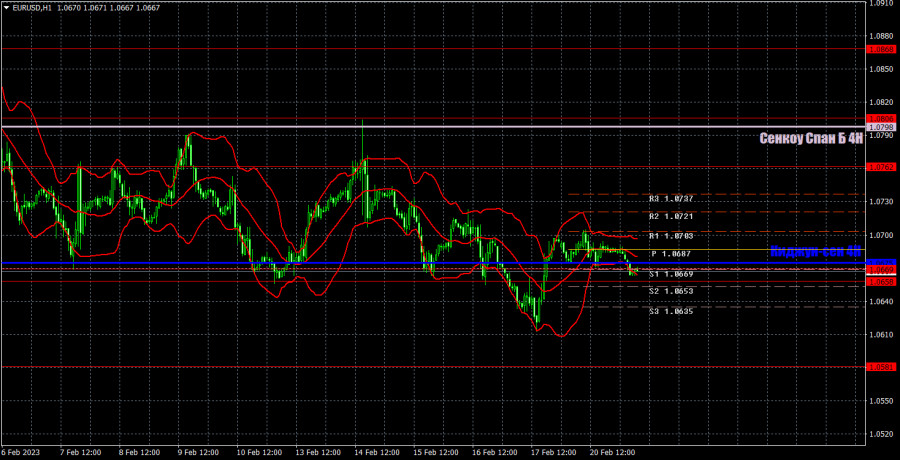
In the 1-hour time frame, the pair is moving down below the psychological line. In fact, it is a weak downward movement. The quote has been in a sideways channel for several days. At this point, it shows signs of a bearish continuation, which is also in line with our expectations. On Tuesday, important levels are seen at 1.0485, 1.0581, 1.0658-1.0669, 1.0762, 1.0806, 1.0868, 1.0938 as well as Senkou Span B (1.0798) and Kijun-sen (1.0675). Ichimoku indicator lines can move intraday, which should be taken into account when determining trading signals. There are also support and resistance although no signals are made near these levels. They could be made when the price either breaks or rebounds from these extreme levels. Do not forget to place Stop Loss at the breakeven point when the price goes by 15 pips in the right direction. In case of a false breakout, it could save you from possible losses. On February 21, the eurozone and the United States will see the release of business activity data. The reaction of the market to these reports will depend on how actual results will differ from forecasts. If they come in line, no reaction will follow at all.

Indicators on charts:

Resistance/support - thick red lines, near which the trend may stop. They do not make trading signals.

Kijun-sen and Senkou Span B are the Ichimoku indicator lines moved to the hourly timeframe from the 4-hour timeframe. They are also strong lines.

Extreme levels are thin red lines, from which the price used to bounce earlier. They can produce trading signals.

Yellow lines are trend lines, trend channels, and any other technical patterns.

Indicator 1 on the COT chart is the size of the net position of each trader category.

Indicator 2 on the COT chart is the size of the net position for the Non-commercial group of traders.

Paolo Greco,
Analytical expert of InstaForex
© 2007-2024
通过InstaForex赚取加密货币汇率变动的收益。
下载MetaTrader 4并开启您的第一笔交易。
  • Grand Choice
    Contest by
    InstaForex
    InstaForex always strives to help you
    fulfill your biggest dreams.
    JOIN CONTEST
  • Chancy Deposit
    Deposit your account with $3,000 and get $1000 more!
    In October we raffle $1000 within the Chancy Deposit campaign!
    Get a chance to win by depositing $3,000 to a trading account. Having fulfilled this condition, you become a campaign participant.
    JOIN CONTEST
  • Trade Wise, Win Device
    Top up your account with at least $500, sign up for the contest, and get a chance to win mobile devices.
    JOIN CONTEST
  • 100% Bonus
    Your unique opportunity to get a 100% bonus on your deposit
    GET BONUS
  • 55% Bonus
    Apply for a 55% bonus on your every deposit
    GET BONUS
  • 30% Bonus
    Receive a 30% bonus every time you top up your account
    GET BONUS

推荐文章

现在无法通话?
提出您的问题,用 在线帮助.
Widget callback