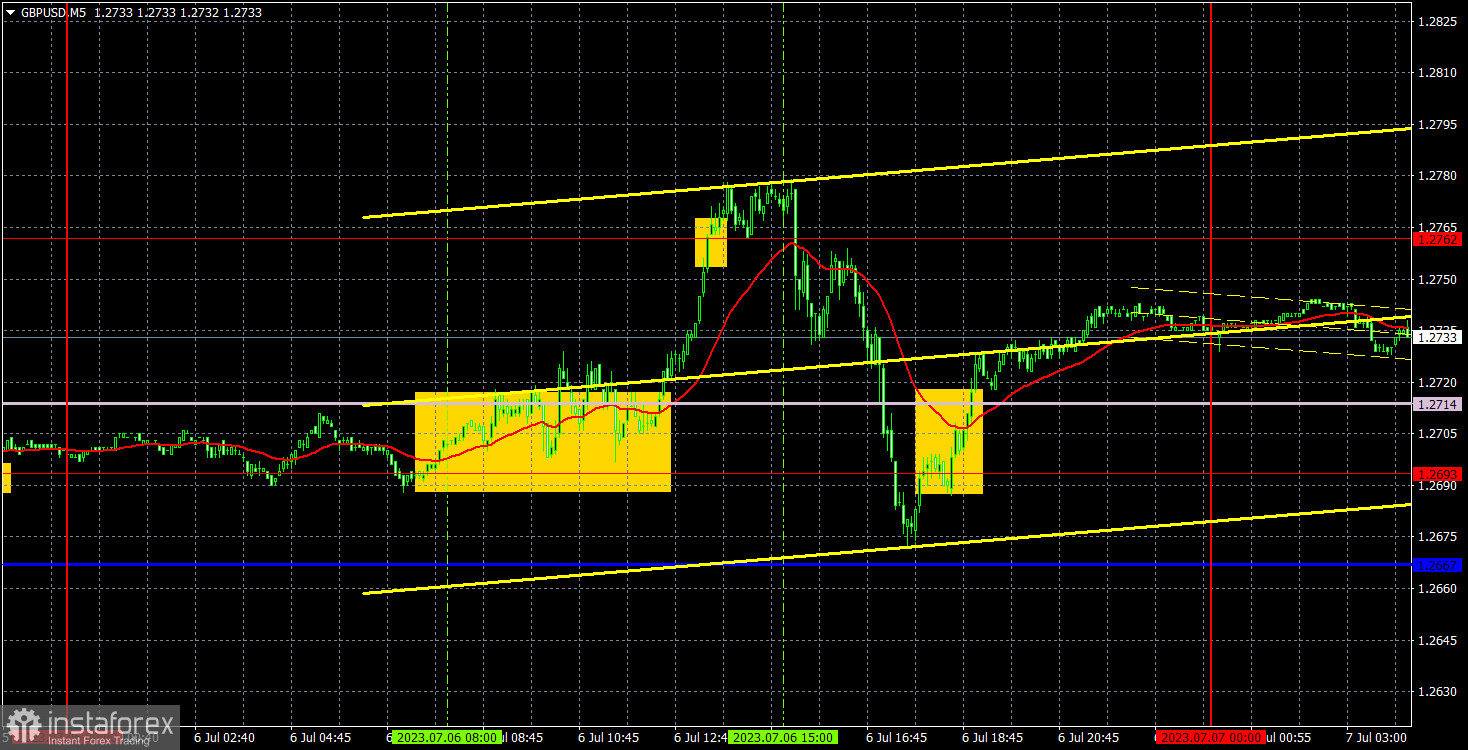
5M chart of GBP/USD
The GBP/USD pair traded very chaotically on Thursday. Especially in the second half of the day, which is not surprising considering the large number of important reports overseas.The ADP and ISM reports turned out to be much higher than forecasts, and applications for unemployment benefits and the number of JOLTs job openings were slightly worse than forecasts. Nevertheless, the market paid more attention to the first two reports, so the dollar rose. And after a few hours, the market forgot about US data and the dollar started to fall again. Therefore, we can make the same conclusion as before: the pound is still relatively high, overbought, but at the same time it uses every opportunity to rise, and corrections are almost always local and formal.
During the European trading session, there was a signal that was safe to execute. The pair overcame the area of 1.2693-1.2714 afterwards it grew to the level of 1.2762 and crossed it as well. After this breakthrough, it was necessary to close long positions in anticipation of the US session with a bunch of important reports. From our point of view, it was better not to enter the market during the US session, as there were many reports and they were not released at the same time. The fall in the end turned out to be powerful, but this wouldn't have happened if the data were weaker. The last buy signal was formed too late. It was possible to earn about 50 points on the first deal.
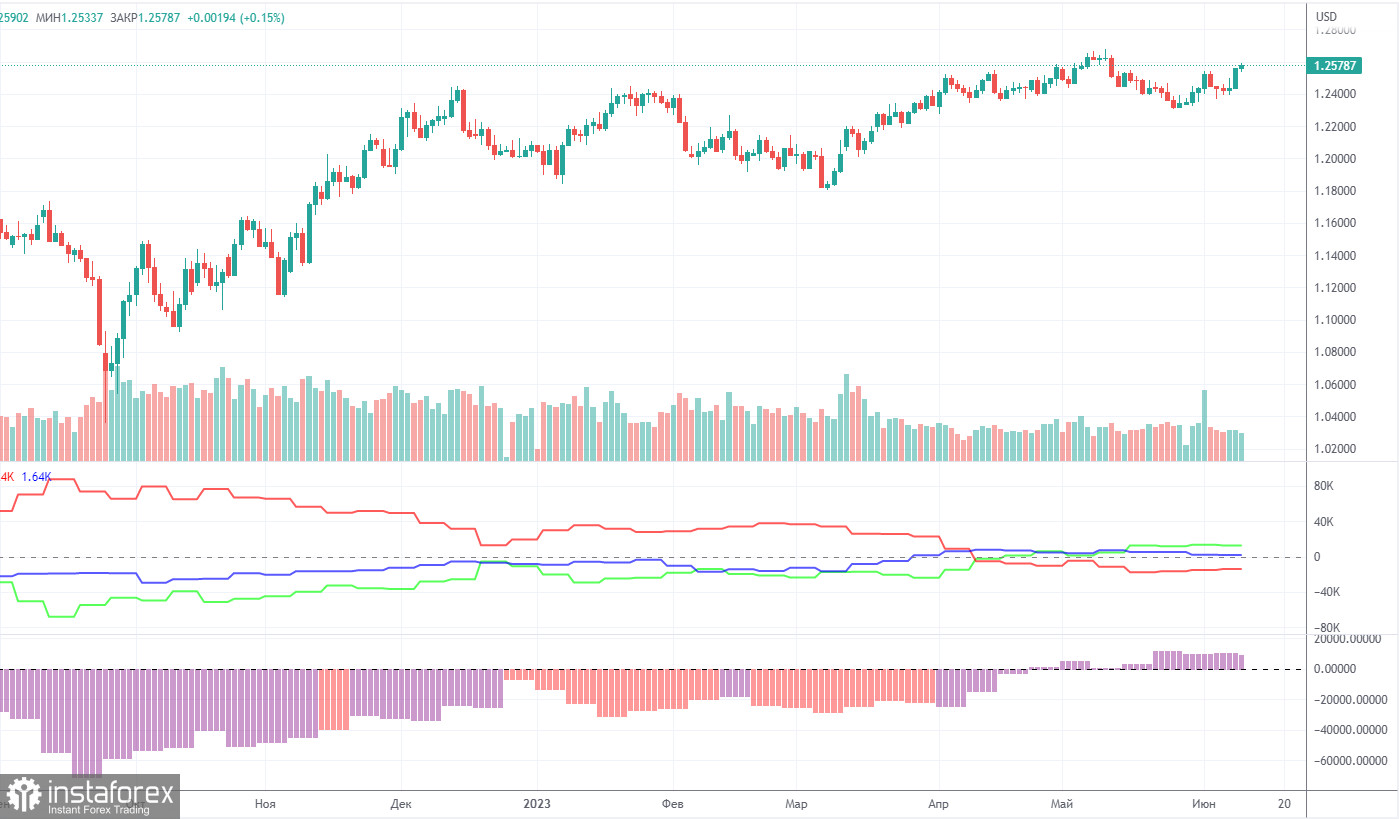
COT report:
According to the latest report, non-commercial traders opened 2,800 long positions and closed 2,500 short ones. The net position increased by 5,300 in just a week and continues to grow. Over the past 9-10 months, the net position has been on the rise. We are approaching a point where the net position has grown too much to expect further growth. We assume that a prolonged bear run may soon begin, even though COT reports suggest a bullish continuation. It is becoming increasingly difficult to believe in it with each passing day. We can hardly explain why the uptrend should go on. However, there are currently no technical sell signals.
The pound has gained about 2,500 pips. Therefore, a bearish correction is now needed. Otherwise, a bullish continuation would make no sense. Overall, non-commercial traders hold 52,300 sell positions and 104,400 long ones. Such a gap suggests the end of the uptrend. We do not see the pair extending growth in the long term.
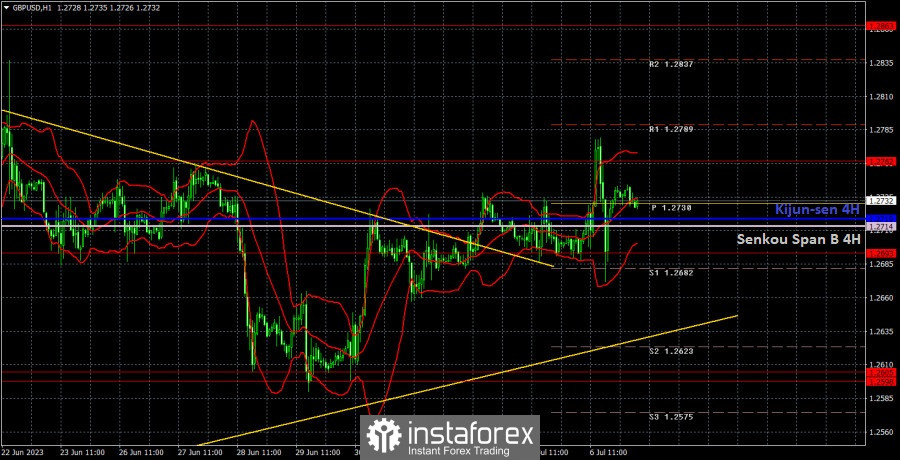
1H chart of GBP/USD
In the 1-hour chart, GBP/USD maintains a bullish bias. The ascending trend line serves as a buy signal. However, we still believe that the British currency is overvalued and should fall in the medium term. The pair overcame the downward trend line, so the pound has an opportunity to show another round of the uptrend. Movements are unstable, with frequent reversals and pullbacks. In addition, volatility is not exactly high right now.
On July 7, trading levels are seen at 1.2349, 1.2429-1.2445, 1.2520, 1.2598-1.2605, 1.2693, 1.2762, 1.2863, 1.2981-1.2987. Senkou Span B (1.2714) and Kijun-sen (1.2719) may also generate signals when the price either breaks or bounces off them. A Stop Loss should be placed at the breakeven point when the price goes 20 pips in the right direction. Ichimoku indicator lines can move intraday, which should be taken into account when determining trading signals. There are also support and resistance which can be used for locking in profits.
No interesting events lined up for the UK. The main items on today's agenda are the labor market and unemployment reports. It is impossible to predict their values in advance, so the volatility may gradually increase and we can even expect sharp price reversals.
Indicators on charts:
Resistance/support - thick red lines, near which the trend may stop. They do not make trading signals.
The Kijun-sen and Senkou Span B lines are the Ichimoku indicator lines moved to the hourly timeframe from the 4-hour timeframe. They are also strong lines.
Extreme levels are thin red lines, from which the price used to bounce earlier. They can produce trading signals.
Yellow lines are trend lines, trend channels, and other technical patterns.
Indicator 1 on the COT chart is the size of the net position of each trader category.
Indicator 2 on the COT chart is the size of the net position for the Non-commercial group of traders.