empty
 
 
11.08.2023 11:25 AM
GBP/USD. Overview for August 11th. The pound approaches the GDP report in a subdued mood

This image is no longer relevant

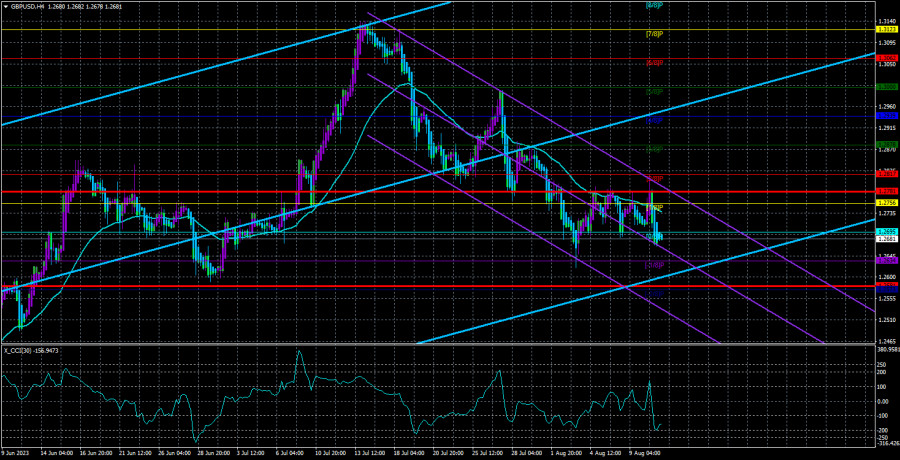
On Thursday, the GBP/USD currency pair attempted to renew its downward momentum but largely stayed within the lateral range, which is noticeable even in the 4-hour timeframe. In the first half of Thursday, the pound increased without apparent reason. This movement might be attributed to traders' expectations regarding the US inflation report. In the second half of the day, a rather sharp decline followed, which, in our view, is quite logical given that US inflation has accelerated. Now the pound is near its local lows, failed to correct upwards, and could resume its decline at any moment.

We currently deem a decline as the most likely scenario. Considering the extent and strength of the British currency's growth, we currently see almost no reason to expect an increase. Even if the Bank of England continues to raise the key rate to 6% or higher, the pound's growth over the past 11 months suggests that this has already been factored into the market. Thus, while the pound might not fall daily, it should decline in the medium term.

In the 24-hour timeframe, the slow downward movement continues. Our minimum target for the decline remains the Senkou Span B line, which lies at the 1.2574 level.

The British economy is unlikely to show growth.

The Q2 UK GDP report will be released in the next half hour. Official forecasts suggest growth of 0-0.1% q/q. The UK economy has been teetering on the edge of recession for four consecutive quarters. Meanwhile, the Bank of England's rate continues to rise, increasing economic growth pressure. We believe the "pound's fairy tale" will end sooner. High rates, high inflation, and a sharp rise in credit costs should lead to an economic downturn—why not in the second quarter? We will find out shortly.

How might this report influence the pair's movement? We can expect a temporary pound strengthening if the value is strong (above forecasts). However, it's worth remembering that while GDP is an important report, it's not the primary driver under current circumstances. If the value is negative, the pair might decline, allowing it to leave the sideways channel more confidently. However, we would not bet on a significant deviation from the predicted value and, consequently, a strong market reaction.

Today, the pair may continue its downward movement and display considerable volatility. However, they're unlikely to be entirely associated with the fundamental and macroeconomic backdrop.

This image is no longer relevant

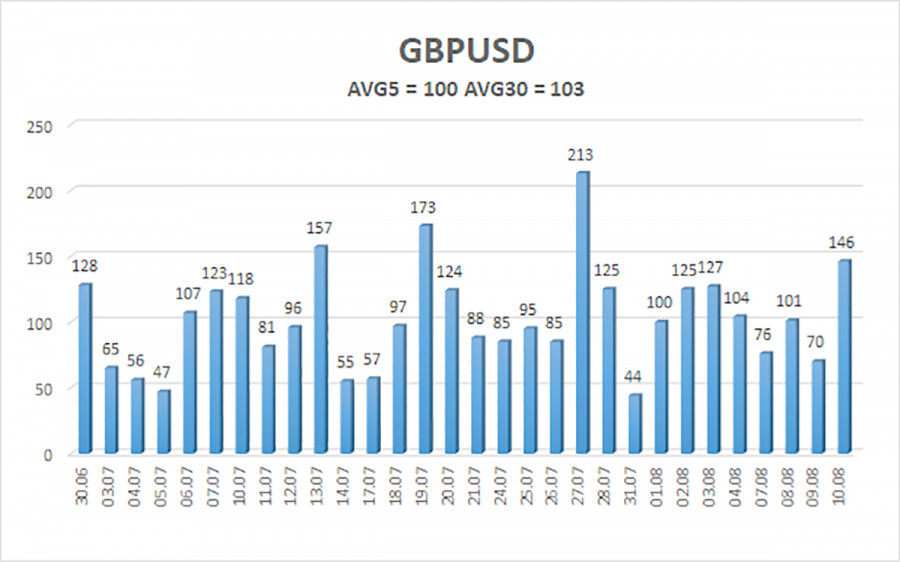
The average volatility of the GBP/USD pair over the last five trading days is 100 points. For the pound/dollar pair, this value is "average." Therefore, on Friday, August 11th, we expect movement within the range limited by levels 1.2581 and 1.2781. A reversal of the Heiken Ashi indicator upward will signal a new round of upward movement within the sideways channel.

Nearest support levels:

S1 – 1.2634

S2 – 1.2573

Nearest resistance levels:

R1 – 1.2695

R2 – 1.2756

R3 – 1.2817

Trading recommendations:

On the 4-hour timeframe, the GBP/USD pair continues to be positioned below the moving average. Short positions with targets at 1.2634 and 1.2581 are relevant and should be held open until the Heiken Ashi indicator reverses upward. Long positions can be considered if the price consolidates above the moving average with targets at 1.2817 and 1.2878. A continuation of the flat trend is also possible now.

Clarifications on illustrations:

Linear regression channels – help identify the current trend. If both are directed in the same way, it means the current trend is strong.

Moving average line (settings 20.0, smoothed) – determines the short-term tendency and the direction in which trading should be conducted.

Murrey levels – target levels for movements and corrections.

Volatility levels (red lines) – the probable price channel in which the pair will operate in the next 24 hours, based on current volatility indicators.

CCI indicator – its entrance into the oversold area (below -250) or the overbought area (above +250) indicates an impending trend reversal in the opposite direction.

Paolo Greco,
Analytical expert of InstaForex
© 2007-2024
Earn on cryptocurrency rate changes with InstaForex
Download MetaTrader 4 and open your first trade
  • Grand Choice
    Contest by
    InstaForex
    InstaForex always strives to help you
    fulfill your biggest dreams.
    JOIN CONTEST
  • Chancy Deposit
    Deposit your account with $3,000 and get $5000 more!
    In November we raffle $5000 within the Chancy Deposit campaign!
    Get a chance to win by depositing $3,000 to a trading account. Having fulfilled this condition, you become a campaign participant.
    JOIN CONTEST
  • Trade Wise, Win Device
    Top up your account with at least $500, sign up for the contest, and get a chance to win mobile devices.
    JOIN CONTEST
  • 100% Bonus
    Your unique opportunity to get a 100% bonus on your deposit
    GET BONUS
  • 55% Bonus
    Apply for a 55% bonus on your every deposit
    GET BONUS
  • 30% Bonus
    Receive a 30% bonus every time you top up your account
    GET BONUS

Recommended Stories

Can't speak right now?
Ask your question in the chat.
Widget callback