GBP/USD continued to appreciate on Monday as if nothing had happened. The gains were not significant, but that doesn't matter. In recent months, the pair's volatility has generally remained weak, so even a 10-20 pip rise still means that the British currency is showing positive trades.
On Monday, there were no significant events or reports in either the UK or the US. Therefore, there was nothing for the market to react to. Nevertheless, the GBP/USD pair opened with a negative gap on Monday (for unknown reasons) and aimed to recoup it throughout the day. However, it is worth mentioning that any movement has some underlying basis. The euro also rose on Monday, likely based on the results of the parliamentary elections in France, where Marine Le Pen's party lost. The British pound likely decided to rise in tandem, as it often does.
It is vital to mention that the market currently seizes any opportunity to buy the euro and the pound or sell the dollar. Sometimes, it has legitimate reasons for such actions, like last week, when practically all the key US macro data disappointed the market. However, on Monday, there were no significant events, and the election results in France have no relation to the British currency.
The market continues to ignore the fundamental background, which is actually important, as there is a high probability that the Bank of England will begin easing its monetary policy on August 1. Often, the market tries to price in a future event in advance, but at this time, we are observing the pound's growth, which does not align with the upcoming monetary policy easing in the UK. Thus, despite the pair's movement last week, there is very little logic behind its movements. After last week's rise, the price did not even attempt to start a minor downward correction. At this rate, the British pound can continue to rise indefinitely, and the market does not need macroeconomic or fundamental reasons.
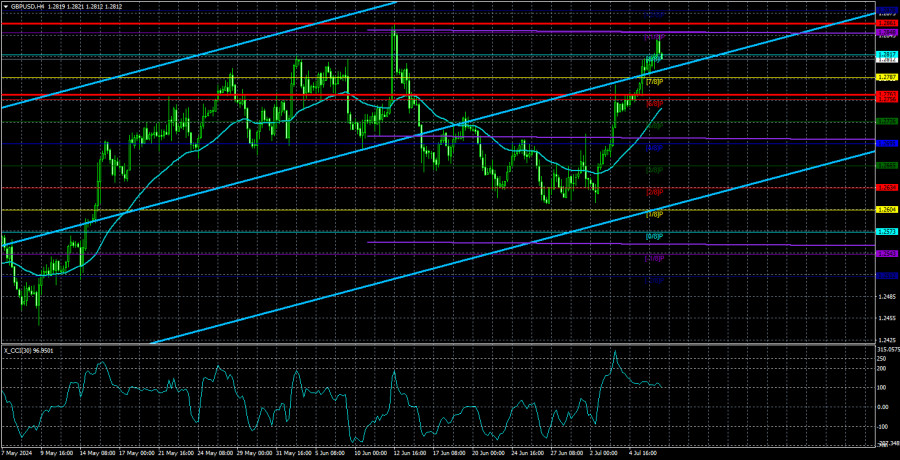
From a technical perspective, the pair has approached its latest local high and is also above the moving average line. Therefore, you may consider buying the pound, if you don't pay attention to the fundamental background. We admit that big players carry out such an illogical movement in order to throw out all the "unwanted players" from the market. However, it is also possible that the pound's rate is being manipulated by major players and market makers who follow their own strategy. After all, it is no secret that the market is ruled by large capitals, not private traders. The problem is that we, as private traders, cannot logically explain why the pound is rising. Therefore, it has been quite uncomfortable to buy the pair.

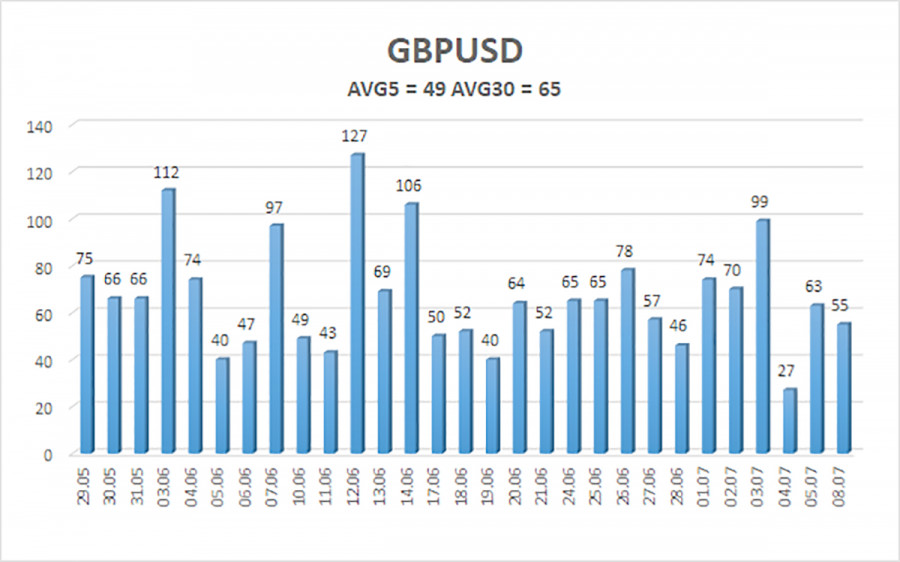
The average volatility of GBP/USD over the last five trading days is 49 pips. This is considered an average value for the pair. Today, we expect GBP/USD to move within a range bounded by the levels of 1.2763 and 1.2861. The higher linear regression channel is pointing upwards, which suggests that the upward trend will continue. Last week, the CCI indicator entered the overbought area and drew divergence from the last two highs, indicating an impending decline.
Nearest support levels:
S1 - 1.2787
S2 - 1.2756
S3 - 1.2726
Nearest resistance levels:
R1 - 1.2817
R2 - 1.2848
R3 - 1.2878
Trading Recommendations:
The GBP/USD pair continues to rise rapidly, ignoring all factors in favor of the dollar. Although the US released quite a number of disappointing data last week, we believe that this isn't enough for the pound to sustain its growth. We don't see how the pound would be able to rise above the level of 1.2817. Yes, a new batch of weak (relative to overestimated forecasts) US data may exert a significant amount of pressure on the dollar once again, and in addition to that the market no longer puts a lot of importance on the fundamental background, the policy of the Federal Reserve and the BoE. Therefore, we cannot say that long positions are the obvious choice at this time. However, the best option now is to trade on the technical picture.
Explanation of Illustrations:
- Linear Regression Channels – Helps determine the current trend. If both are directed in the same direction, it means the trend is currently strong.
- Moving Average Line (settings 20.0, smoothed) – Determines the short-term trend and the direction in which trading should currently be conducted.
- Murray Levels – Target levels for movements and corrections.
- Volatility Levels (red lines) – The probable price channel in which the pair will spend the next day, based on current volatility indicators.
- CCI Indicator – Its entry into the oversold area (below -250) or the overbought area (above +250) means that a trend reversal in the opposite direction is imminent.


