Analysis of GBP/USD 5M
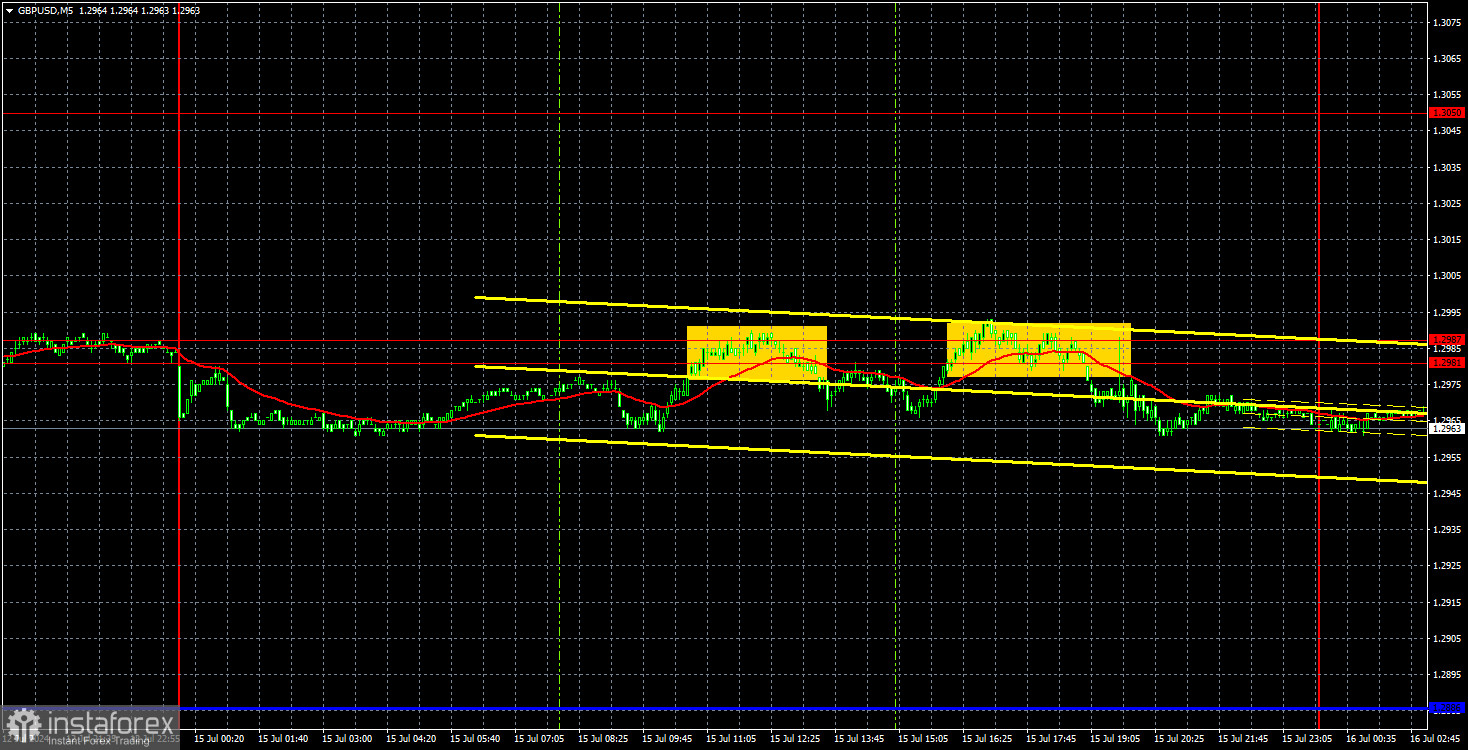
GBP/USD tried to overcome the area of 1.2981-1.2987 twice during Monday, but failed to do so. It was even strange to see that the pair failed to overcome this area. Usually, the pound manages to find a reason to rise any day. However, it seems that it still needs to take a break from time to time as well. On Monday, there were no important economic reports. Thus, the 30-pip volatility is self-explanatory. The pair is still trading within the horizontal channel, and this week a local flat began. It is worth mentioning that in case the flat continues this week and the price leaves the ascending channel, it will not guarantee a downward trend.
In general, the British currency continues to grow in value. The recent U.S. economic reports have really hurt the dollar's prospects, but it should be realized that macroeconomics is not the only thing that matters. There are also fundamentals and techniques, at the very least. The market only considers those factors that are against the U.S. dollar. That is why the greenback is constantly falling. It is quite difficult to say how long this state of affairs will continue.
There were two trading signals on Monday. The price bounced twice from the area of 1.2981-1.2987. Traders could consider these signals for opening short positions, as signals are signals. However, as we have repeatedly mentioned, it doesn't make sense to count on the fact that a signal will be formed and the nearest target will be reached within a day. Therefore, we can stay in short positions and count on at least some downward correction. However, it is vital to mention that the absence of a strong macroeconomic background does not mean that the market will not start buying the pound again.
COT report:
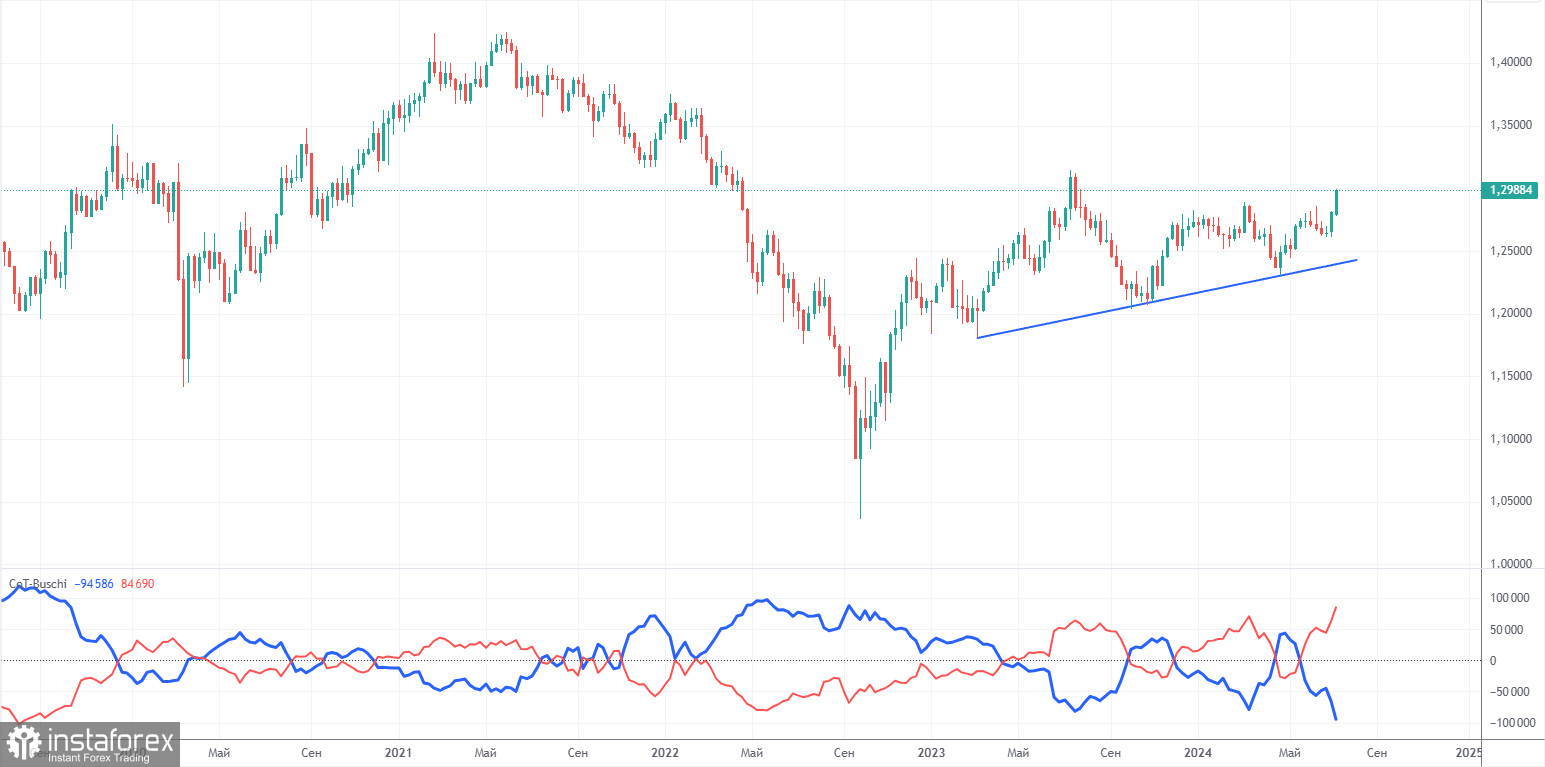
COT reports on the British pound show that the sentiment of commercial traders has frequently changed in recent years. The red and blue lines, which represent the net positions of commercial and non-commercial traders, constantly intersect and mostly remain close to the zero mark. According to the latest report on the British pound, the non-commercial group opened 28,600 buy contracts and 5,900 short ones. As a result, the net position of non-commercial traders increased by 22,700 contracts over the week. Thus, sellers failed to seize the initiative once again.
The fundamental background still does not provide a basis for long-term purchases of the pound sterling, and the currency has a good chance to resume the global downward trend. However, the price has already breached the trend line on the 24-hour timeframe at least twice. The pound sterling is rising despite almost everything, and such a movement is extremely difficult to predict.
The non-commercial group currently has a total of 135,300 buy contracts and 50,600 sell contracts. The bulls are taking the lead in the market, but aside from the COT reports, nothing else suggests a potential rise in the GBP/USD pair. And such a strong advantage suggests a potential change in trend.
Analysis of GBP/USD 1H
On the 1H chart, GBP/USD continues to show positive trades. Now traders have an ascending channel at their disposal, and almost all the macro data provokes traders to open long positions. The market chooses to ignore good U.S. reports that can support the dollar. Therefore, we can only expect the dollar to strengthen when the price consolidates below the ascending channel.
As of July 16, we highlight the following important levels: 1.2215, 1.2269, 1.2349, 1.2429-1.2445, 1.2516, 1.2605-1.2620, 1.2691-1.2701, 1 ,2796-1.2816, 1.2863, 1.2981-1.2987. The Senkou Span B (1.2730) and Kijun-sen (1.2886) lines can also serve as sources of signals. Don't forget to set a Stop Loss to breakeven if the price has moved in the intended direction by 20 pips. The Ichimoku indicator lines may move during the day, so this should be taken into account when determining trading signals.
On Tuesday, the UK event calendar is empty, while the U.S. will release its retail sales report. This is an interesting report, but no more. Most likely, we're in for another boring day with low-volatility movements. Maybe the pound will correct lower at least a little, but in general it can calmly continue the local flat.
Description of the chart:
Support and resistance levels are thick red lines near which the trend may end. They do not provide trading signals;
The Kijun-sen and Senkou Span B lines are the lines of the Ichimoku indicator, plotted to the 1H timeframe from the 4H one. They provide trading signals;
Extreme levels are thin red lines from which the price bounced earlier. They provide trading signals;
Yellow lines are trend lines, trend channels, and any other technical patterns;
Indicator 1 on the COT charts is the net position size for each category of traders;