The EUR/USD pair stood in the same place throughout Tuesday. As we warned earlier, European data did not elicit any reaction from traders. Last week's U.S. GDP report, which turned out to be strong and resonant, did not provoke any market reaction. Therefore, it was naive to hope that the market would actively respond to the European and German GDP data with their low values.
The same goes for the report on German inflation. The Consumer Price Index in Germany accelerated to 2.3% in July, which means nothing and has no impact. This is because the European Central Bank has already begun to lower its borrowing costs, and the overall Eurozone CPI is far more significant than the inflation rate of just one of the 27 countries. Thus, despite their seemingly significant headlines, the three European reports did not influence the pair's movement at all, at least during the European trading session.
The pair started to fall during the U.S. session, but what could have caused it? If German inflation accelerated, this would likely be more positive than negative for the euro. It means that the ECB might hold the current rate a bit longer and reduce it more slowly in the future. According to the initial estimate, the Eurozone GDP grew by 0.3% in the second quarter, compared to the forecast of +0.2%. Thus, this report should have been more likely to cause an increase in the euro than a decline. It is doubtful that the market reacted to the weak German GDP report while ignoring the Eurozone GDP and German inflation.
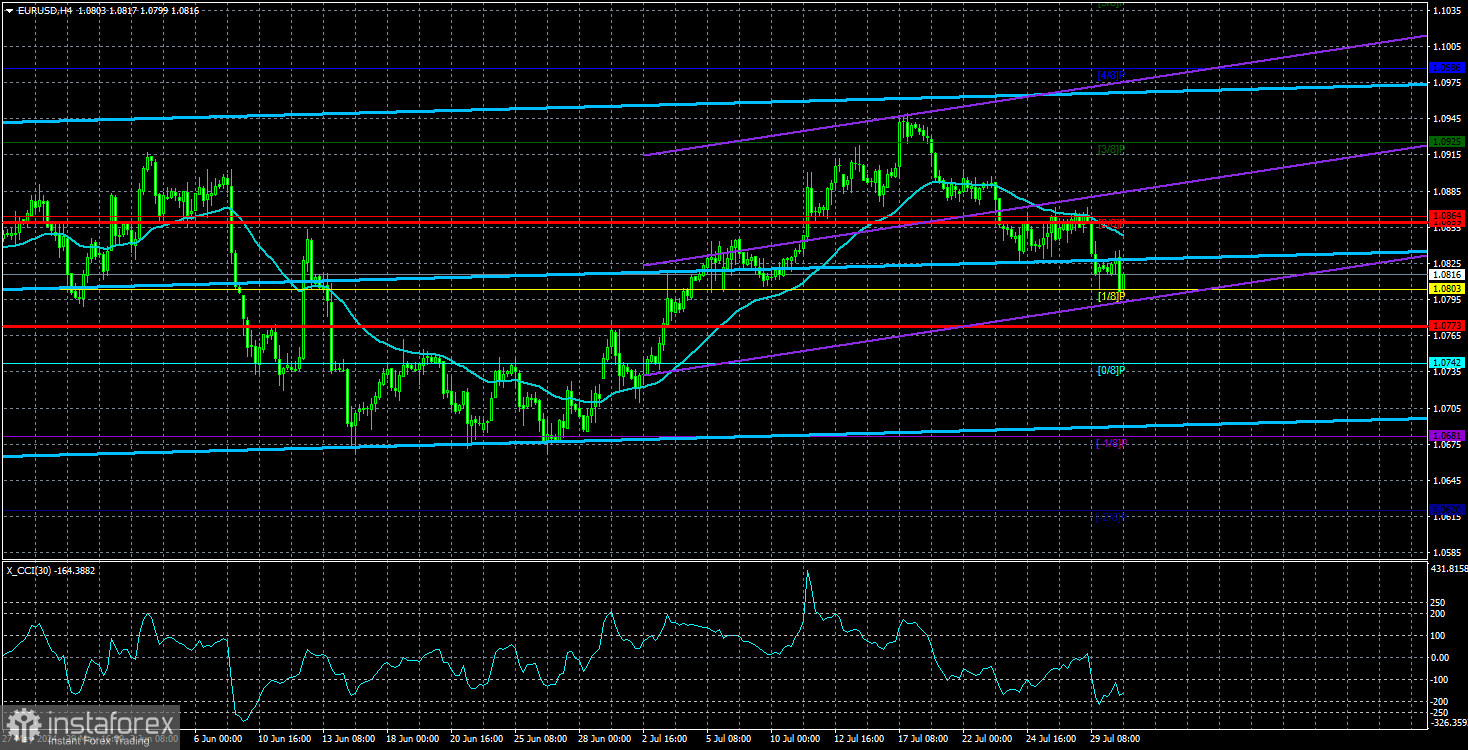
Thus, we believe that the decline in the EUR/USD pair was driven by the same technical factors we mentioned earlier. The pair has been trading within a horizontal channel for seven months. Since a reversal occurred near the upper boundary, we can expect the pair to move towards the lower boundary of the channel, around the 1.0600 level. It's unlikely this level will be reached perfectly, as perfect scenarios rarely happen in the market. However, we can at least consider where the pair might move next around this level.
The downward trend remains intact in the long term, which began exactly one year ago, last summer. Therefore, after the current flat phase ends, we expect the euro to resume its decline. By the time this happens, the Federal Reserve may have already started lowering its rate. However, we are no longer confident that easing monetary policy in the U.S. will guarantee a decline in the U.S. dollar. We believe that the market has been pricing in its unrealized hopes for a rate cut since the beginning of the year. Likely, 2 or 3 rate cuts by the Fed have already been priced in. Therefore, we first expect a decline to the 1.0600 level, and then we will look at the technical picture and the fundamental backdrop. Even if both the ECB and the Fed lower rates simultaneously, it still does not favor the growth of the single currency.
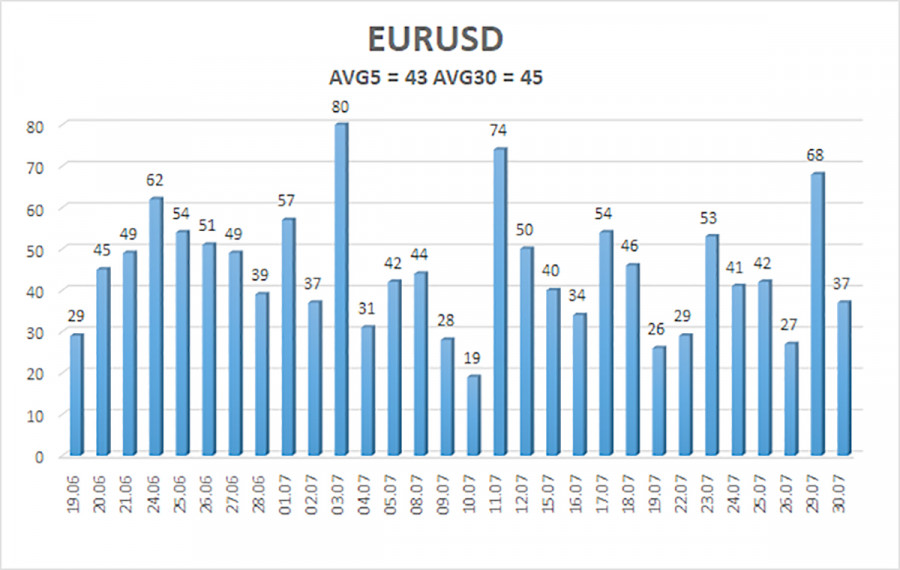
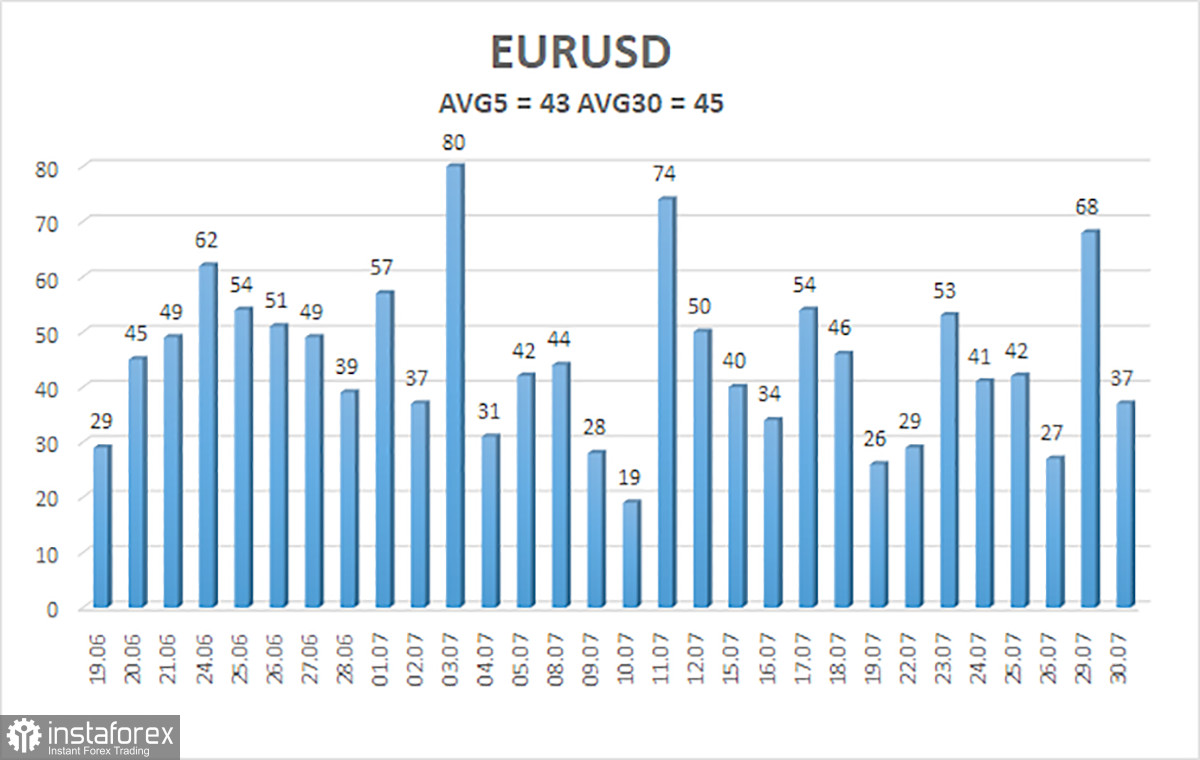
The average volatility of the EUR/USD currency pair over the past five trading days as of July 31 is 43 pips, which is considered low. We expect the pair to move between the levels of 1.0773 and 1.0859 on Wednesday. The higher linear regression channel is directed upwards, but the downward trend persists. The CCI indicator entered the overbought area, the first warning of a potential trend change.
Nearest Support Levels:
- S1 – 1.0803
- S2 – 1.0742
- S3 – 1.0681
Nearest Resistance Levels:
- R1 – 1.0864
- R2 – 1.0925
- R3 – 1.0986
Trading Recommendations:
The EUR/USD pair maintains a global downward trend; a downward movement continues in the 4-hour time frame. In previous reviews, we mentioned that we are only expecting the continuation of the global downward trend. We do not believe the euro can start a new global trend amid the ECB's monetary policy easing, so the pair will likely fluctuate between 1.0600 and 1.1000 for some time. Since the price is currently in the upper part of this range, short positions with targets around the Murray level "-1/8" - 1.0681 are more valid.
Explanations for Illustrations:
Linear Regression Channels: help determine the current trend. If both are directed in the same direction, it means the trend is strong.
Moving Average Line (settings 20,0, smoothed): determines the short-term trend and the direction in which trading should be conducted.
Murray Levels: target levels for movements and corrections.
Volatility Levels (red lines): the probable price channel in which the pair will spend the next 24 hours, based on current volatility indicators.
CCI Indicator: Entering the oversold area (below 250) or the overbought area (above +250) means a trend reversal is approaching.