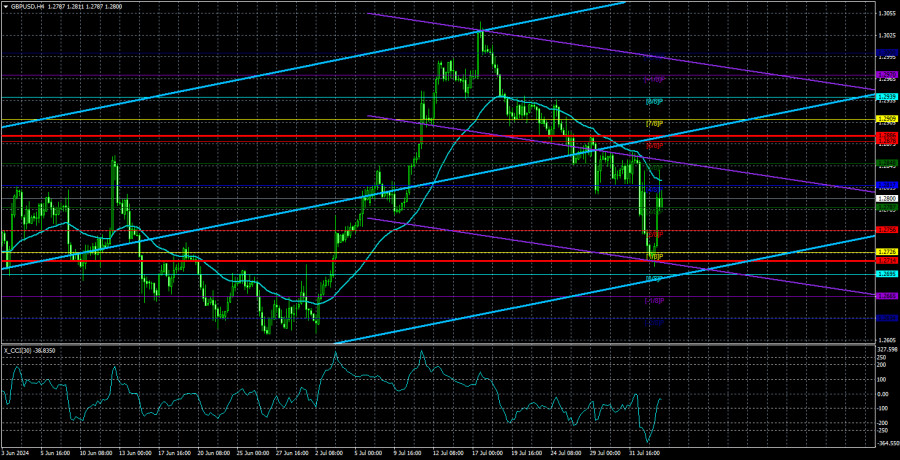
The GBP/USD pair also showed a bullish bias on Friday, triggered by U.S. macroeconomic data. Days earlier, the Bank of England decided to begin easing monetary policy. As a result, the British currency plummeted on Thursday. However, fate again favored the British pound, which quickly recovered Thursday's losses.
However, as with the euro, nothing has changed for the pound. The key factor—the interest rate factor—still implies a decline in the British currency. As with the euro, the pound grew much more frequently in 2024 than the situation, macroeconomic, and fundamental background required. It remains overbought and unjustifiably expensive. Thus, even after another disappointing U.S. data, we expect only a decline in the British currency.
The GBP/USD pair may sustain its upward correction in the coming days, but it has yet to consolidate above the moving average line. And the disappointing U.S. data will come only sometimes. Therefore, this week, the pair's decline may resume. We also want to note that several easings of monetary policy by the Federal Reserve have already been priced into the market. Simply because traders have been expecting rate cuts since the beginning of the year and are confident that the U.S. central bank will soon lower rates, however, this has not happened. However, the attitude towards the BoE and its monetary policy differs entirely. Initially, the market expected easing to begin in autumn-winter, and last week, it reacted to the rate cut as if it was completely unexpected. In other words, expectations for a rate cut in the U.S. since the beginning of the year have been much higher and stronger than for a rate cut in the UK. We believe that this factor will continue to push the pound down.
It is also worth noting that the economic situation in the UK is no better than that in the U.S. We would even say the opposite. The weakest reports in the U.S. are much stronger than the strongest in the UK. This is visible, at least in the GDP indicator. The fact that inflation in Britain has been on target for two months now, while in the U.S., it has not been able to fall below 3% for more than a year, tells us about a much more likely continuation of monetary policy easing in Britain and a relatively weak likelihood of seeing the first rate cut in the U.S. in September.
In the 24-hour time frame, the pair has consolidated below the critical Kijun-sen line, allowing it to continue declining at least to the Senkou Span B line, which lies at 1.2578. We do not make a tragedy out of the dollar's fall on Friday, as in 2024, it often fell when there was no reason. Formally, all of the pound's upward movement since October 4, 2023, is still an upward correction against a more substantial preceding fall. Therefore, the pair retains a downward trend globally.
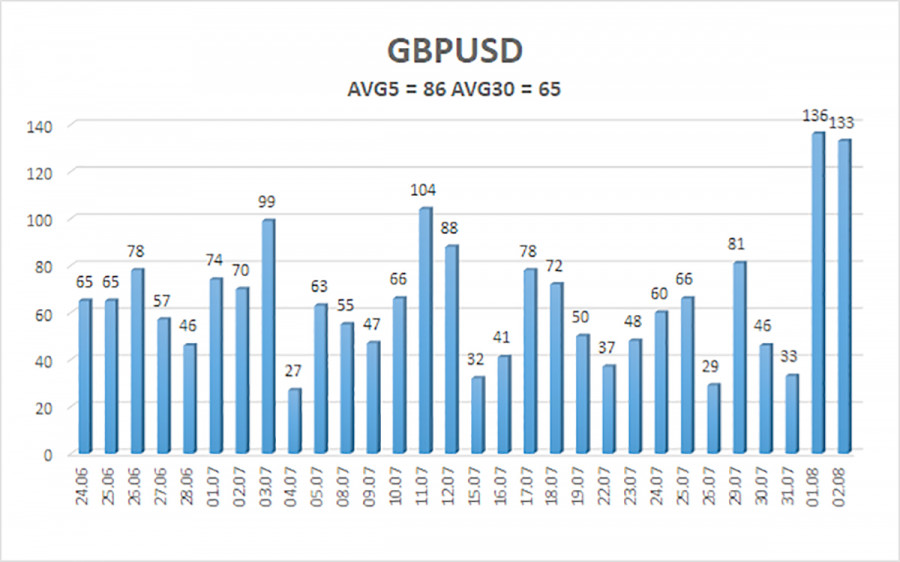
The average volatility of GBP/USD over the last five trading days is 86 pips. This is considered a "medium" value for the pair. On Monday, August 5, we expect movement within the range limited by 1.2714 and 1.2886. The higher linear regression channel is directed upwards, signaling the continuation of the upward trend. The CCI indicator has formed a new bullish divergence, but we do not yet expect strong growth of the British currency. Most likely, there will be an upward retracement.
Nearest Support Levels:
- S1 – 1.2787
- S2 – 1.2756
- S3 – 1.2726
Nearest Resistance Levels:
- R1 – 1.2817
- R2 – 1.2848
- R3 – 1.2878
Trading Recommendations:
The GBP/USD pair continues to trade below the moving average line and has a real chance for continuing the bearish momentum. Volatility remains low, but short positions are currently valid, with initial targets at 1.2695 and 1.2634. We are not considering long positions at the moment, as all the bullish factors for the British currency (which are not much) have already been processed by the market multiple times. The pound sterling may continue to correct this week, but we do not believe it is advisable to act on this correction.
Explanations for Illustrations:
Linear Regression Channels: help determine the current trend. If both are directed in the same direction, it means the trend is strong.
Moving Average Line (settings 20,0, smoothed): determines the short-term trend and the direction in which trading should be conducted.
Murray Levels: target levels for movements and corrections.
Volatility Levels (red lines): the probable price channel in which the pair will spend the next 24 hours, based on current volatility indicators.
CCI Indicator: Entering the oversold area (below 250) or the overbought area (above +250) means a trend reversal is approaching.


