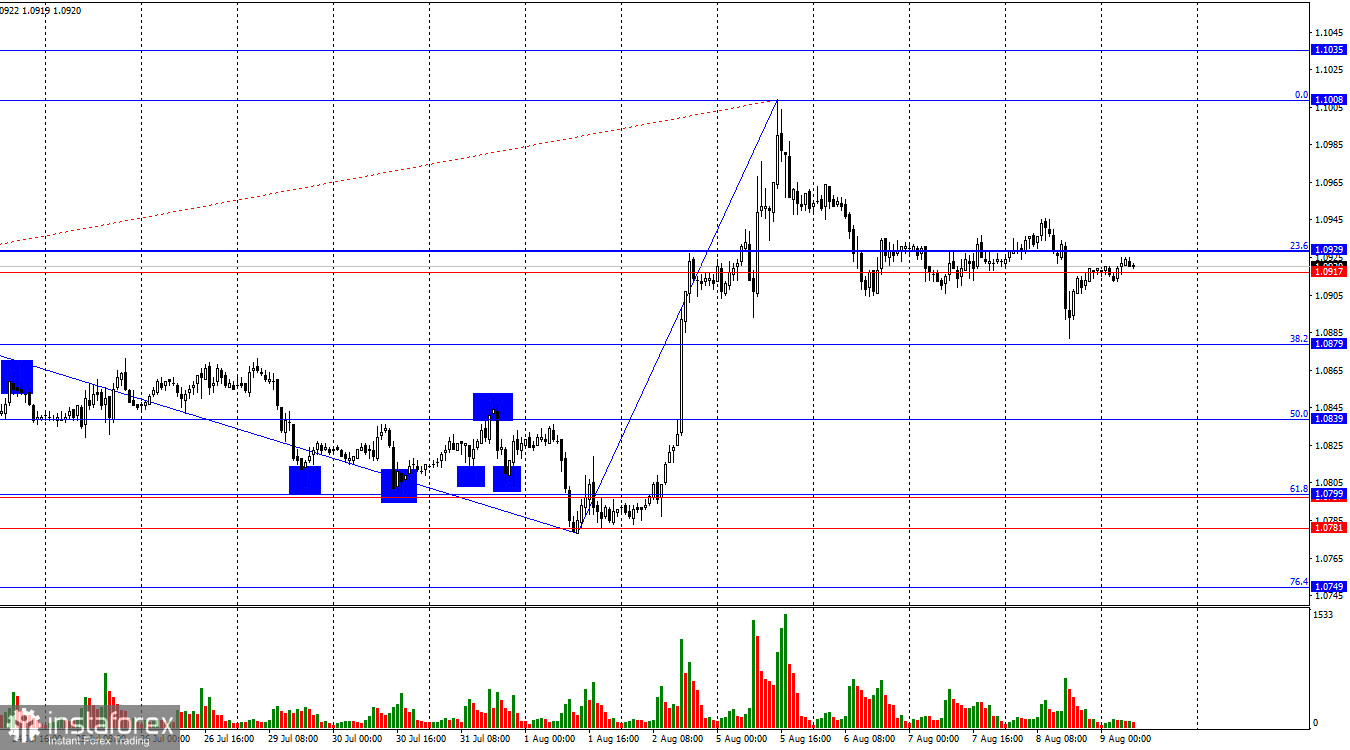
On Thursday, the EUR/USD pair resumed its decline towards the 38.2% corrective level at 1.0879, but it fell just a few points short. The pair then reversed near this level and returned to the 1.0917–1.0929 zone. A rebound from this zone today would indicate a new drop in the euro towards the 1.0879 level, while consolidation above it would suggest growth towards the 0.0% corrective level at 1.1008. However, this zone is not particularly strong on its own, and false signals may form around it.
The wave situation has become slightly more complicated, but overall it does not present significant concerns. The last completed downward wave did not break the low of the previous wave, while the most recent upward wave broke the peak from July 16. Thus, the "bullish" trend is still intact. To end the "bullish" trend, bears need to break the low of the last downward wave near the 1.0778 level. Even better would be a consolidation below the 1.0781–1.0799 zone, which serves as a strong support.
The information background on Wednesday was very weak. A single report on initial jobless claims in the U.S. was slightly better than expected, which likely triggered some activity from the bears, who also act as bulls for the dollar. However, the rise in the U.S. dollar was short-lived. This week, important news is almost completely absent, so traders are taking a cautious stance, especially after Friday and Monday's events. The overall market sentiment remains "bullish," largely due to increased market concerns about a possible 0.50% rate cut by the FOMC in September. These concerns are not unfounded; the U.S. labor market continues to cool, and the unemployment rate is rising. At the last Federal Reserve meeting, Jerome Powell suggested that the regulator might have to intervene if the economy slows down too much.
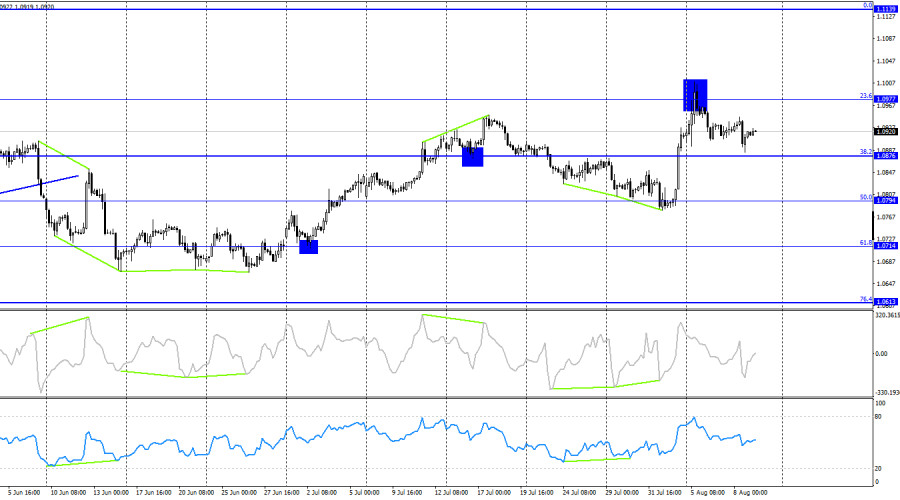
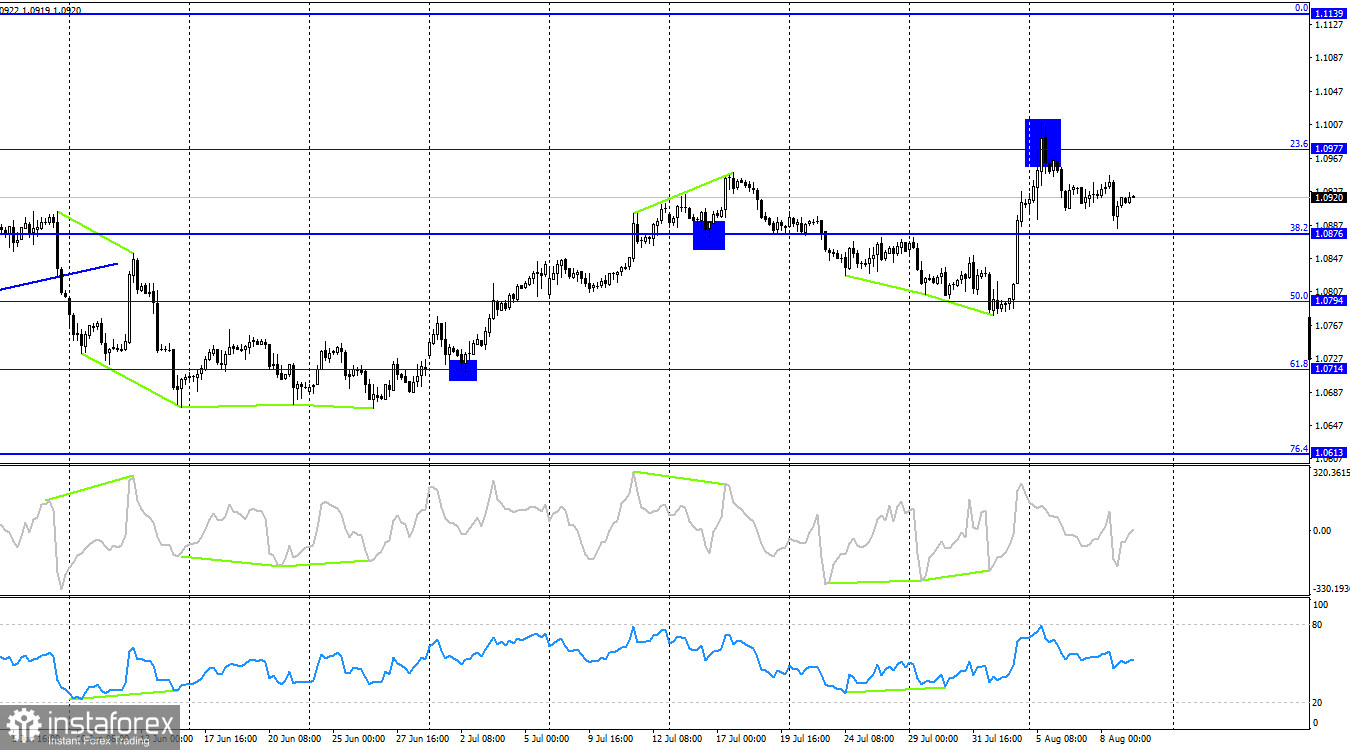
On the 4-hour chart, the pair rebounded from the 23.6% corrective level at 1.0977 and reversed in favor of the U.S. dollar. Thus, the decline in the pair's quotes could continue towards the next Fibonacci level at 38.2% – 1.0876. Consolidation above 1.0977 will increase the likelihood of continued growth towards the next corrective level at 0.0% – 1.1139. No potential divergences are observed in any of the indicators today.
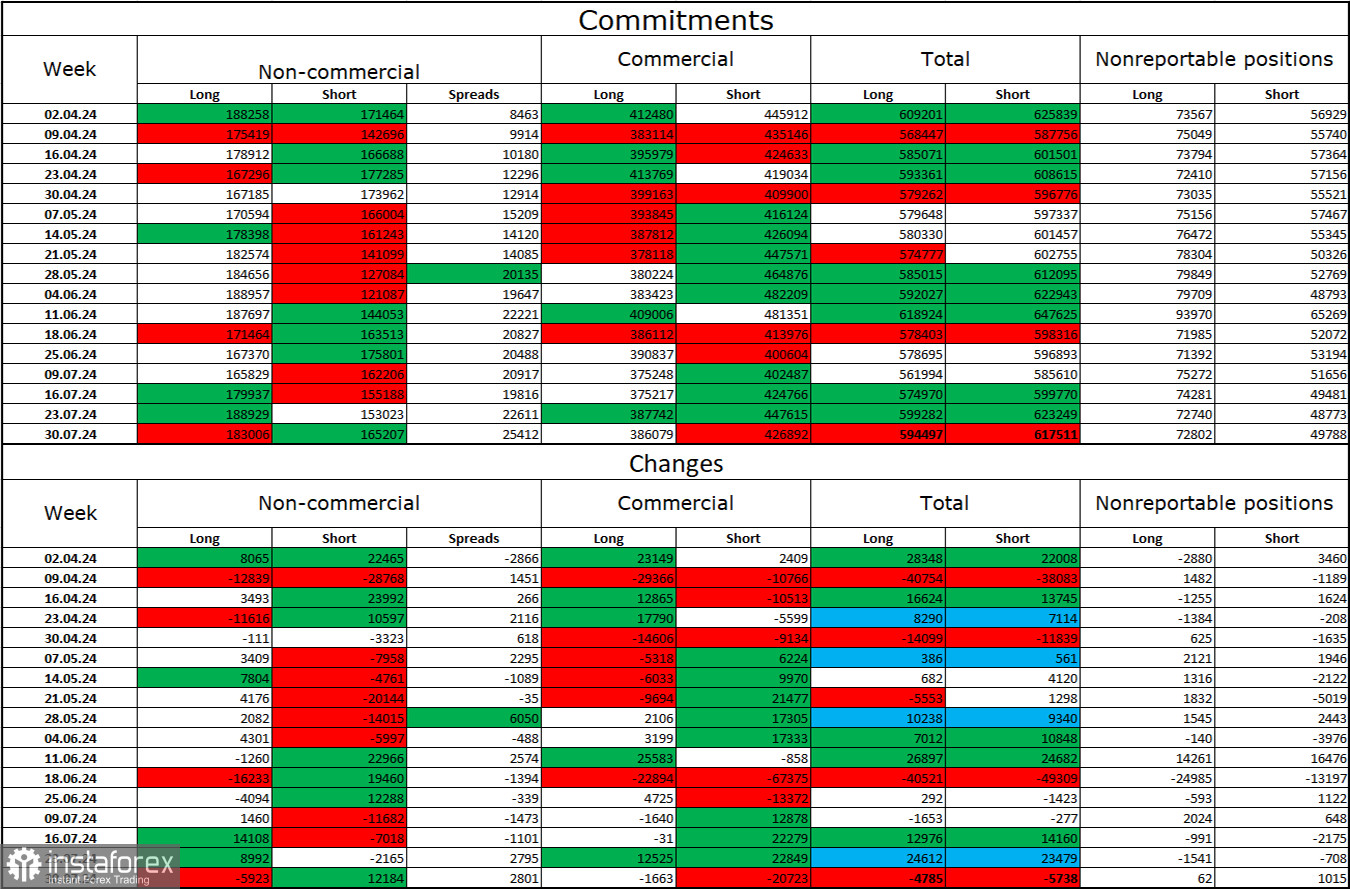
Commitments of Traders (COT) Report:
During the latest reporting week, speculators closed 5,923 long positions and opened 12,184 short positions. The "Non-commercial" group shifted to a "bearish" sentiment a couple of months ago, but bulls still dominate for now. The total number of long positions held by speculators now stands at 183,000, while short positions are at 165,000.
I still believe the situation will continue to shift in favor of the bears. I see no long-term reasons to buy the euro, as the ECB has begun easing monetary policy, which will reduce the yield on bank deposits and government bonds. In the U.S., yields will remain high at least until September, making the dollar more attractive to investors. The potential for a decline in the euro looks substantial. However, one should not forget about the graphical analysis, which at this time does not allow for a confident prediction of a strong decline in the euro, as well as the information background, which regularly throws obstacles in the dollar's path.
News Calendar for the U.S. and Eurozone:
Eurozone – Consumer Price Index in Germany (06:00 UTC).
The economic events calendar for August 9 contains only one entry, which is secondary. The impact of the information background on market sentiment for the rest of the day will be absent.
Forecast for EUR/USD and Trading Tips:
Selling opportunities were possible with a target of 1.0879 on the hourly chart, as the pair consolidated below the support zone at 1.0917–1.0929. This target was almost reached. Today, selling opportunities may arise with a similar signal. Buying opportunities will be possible if the pair consolidates above the support zone at 1.0917–1.0929 on the hourly chart, with a target of 1.1008. In both cases, one should not expect strong growth or decline.
The Fibonacci level grids are built from 1.0668 to 1.1008 on the hourly chart and from 1.0450 to 1.1139 on the 4-hour chart.