empty
20.08.2024 04:23 PM
Analysis for GBP/USD pair on August 20, 2024

This image is no longer relevant

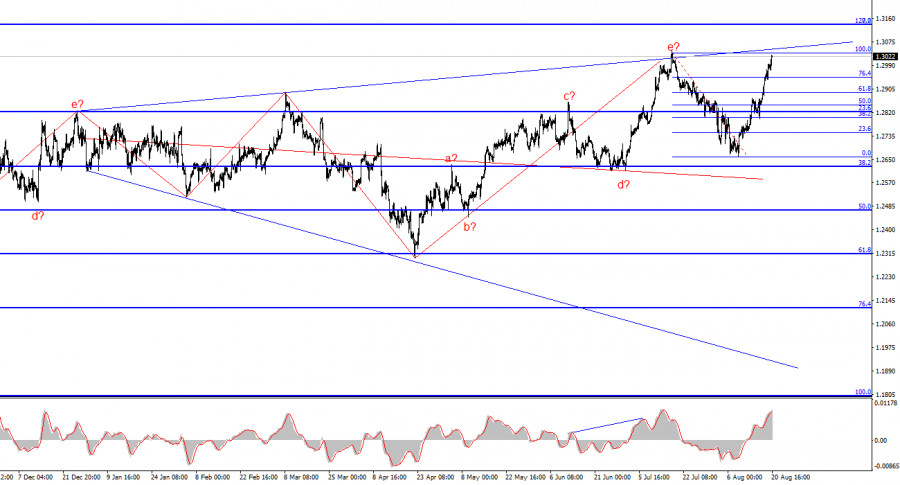
The wave analysis for GBP/USD remains quite complex and ambiguous. For a while, the wave pattern appeared quite convincing, suggesting a downward wave sequence with targets below the 1.2300 level. However, in practice, demand for the U.S. dollar surged too significantly to realize this scenario.

Currently, the wave pattern has become completely unreadable. As a reminder, I prefer to use simple structures in my analysis because complex ones involve too many nuances and ambiguities. We now observe an upward wave that has overlapped a downward wave, which in turn overlapped a previous upward wave, which itself overlapped a prior downward wave (all within a triangle). The only assumption now is an expanding triangle with the upper point around the 1.3000 level and a balancing line around the 1.2600 level. The upper line of the triangle has been reached, and an unsuccessful attempt to break through it indicated the market's readiness to build a downward wave sequence, the first of which is already complete, and the second is nearing completion.

The GBP/USD rate increased by 45 basis points on Monday, 90 on Friday, and another 35 on Tuesday. The pound has been rising for four consecutive days from the last pullback. If we consider the very beginning, the pound has been on an upward trajectory for nine consecutive days. Last week, there was at least some news that could have reduced demand for the U.S. dollar. Reports on inflation and producer prices in the U.S., which showed a decline, could have contributed to the dollar's fall. However, no significant news has emerged this week. The market continues to reduce demand for the dollar following Jerome Powell's Friday speech and expectations of a Fed rate cut in September.

As with EUR/USD, I have one simple question: If the two reasons for the dollar's decline are Powell's speech and the rate cut in September, how long will the dollar's decline continue? The first possible answer is obvious—until Friday. However, Powell will speak, and the factor of a rate cut in September, which no one doubts now, remains. Despite the market's confidence in the policy easing on September 18 for the past three weeks, this factor still exerts significant pressure on the U.S. dollar. The wave pattern for GBP/USD might become even more complex and unreadable today. At the moment, the instrument is unable to build even a classic three-wave correction. If the pound cannot construct a simple three-wave correction, what more complex wave structures can be discussed?

This image is no longer relevant

General Conclusions

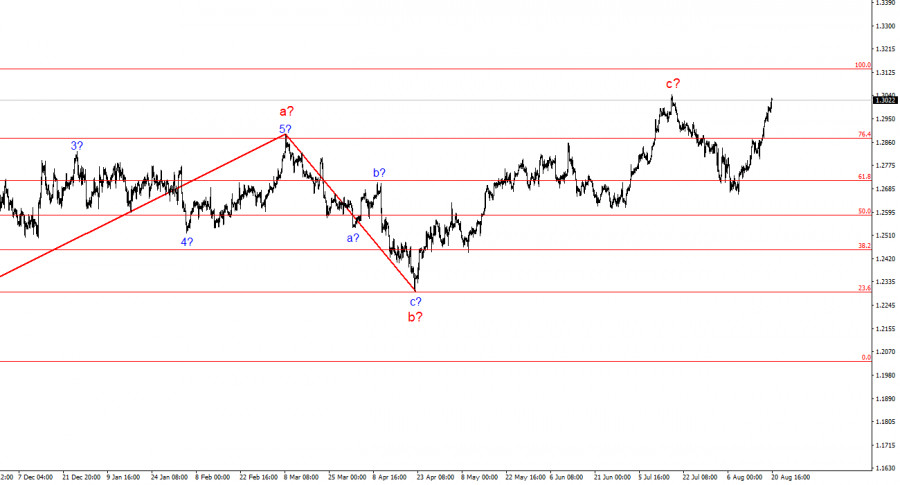
The wave pattern for GBP/USD still suggests a decline. If the upward phase of the trend began on April 22, it has already taken on a five-wave form. Therefore, at this point, a minimum of a three-wave correction should be expected. In my opinion, the instrument should be considered for sales with targets around the 1.2627 level, which corresponds to the 38.2% Fibonacci retracement, and lower. I believe that a rebound from the 1.3033 level will provide a good entry point. If the rebound is not clear and precise, it is better not to trade it.

On a larger wave scale, the wave pattern has transformed. We can now assume the development of a complex and extended upward corrective structure. Currently, it is a three-wave structure, but it could transform into a five-wave structure, which might take several more months or longer to complete.

Key Principles of My Analysis

  1. Wave structures should be simple and understandable. Complex structures are difficult to trade and often subject to changes.
  2. If there is no confidence in what is happening in the market, it is better not to enter it.
  3. Absolute certainty in the direction of movement is neither possible nor ever guaranteed. Do not forget about protective Stop Loss orders.
  4. Wave analysis can be combined with other types of analysis and trading strategies.
Chin Zhao,
Analytical expert of InstaForex
© 2007-2025
Select timeframe
5
min
15
min
30
min
1
hour
4
hours
1
day
1
week
Earn on cryptocurrency rate changes with InstaForex
Download MetaTrader 4 and open your first trade
  • Grand Choice
    Contest by
    InstaForex
    InstaForex always strives to help you
    fulfill your biggest dreams.
    JOIN CONTEST

Recommended Stories

Analysis for GBP/USD on March 26, 2025

The wave pattern for GBP/USD remains somewhat ambiguous but overall workable. There is still a high probability of a long-term bearish trend forming. Wave 5 has taken a clear shape

Chin Zhao 17:37 2025-03-26 UTC+2

Analysis for GBP/USD on March 25, 2025

The wave pattern for GBP/USD remains somewhat ambiguous but still manageable. Currently, there is a high probability of a long-term downward trend forming. Wave 5 has taken a convincing shape

Chin Zhao 18:36 2025-03-25 UTC+2

Weekly Forecast Based on Simplified Wave Analysis for GBP/USD, AUD/USD, USD/CHF, EUR/JPY, #Ethereum, #Litecoin – March 24th

In the coming days, GBP is expected to move sideways with a flat bias. Pressure on the lower boundary of the support zone is possible, followed by stabilization

Isabel Clark 11:21 2025-03-24 UTC+2

Weekly Forecast Based on Simplified Wave Analysis: EUR/USD, USD/JPY, GBP/JPY, USD/CAD, #Bitcoin, #Ripple – March 24th

A continuation of the overall sideways movement of the euro is expected in the coming week, fluctuating between the nearest opposing zones. A downward vector is more likely

Isabel Clark 11:13 2025-03-24 UTC+2

Analysis for GBP/USD on March 21, 2025

The wave structure for GBP/USD remains somewhat ambiguous, but overall manageable. At present, there's still a high probability of a long-term downward trend developing. Wave 5 has taken

Chin Zhao 18:42 2025-03-21 UTC+2

Analysis for EUR/USD on March 21, 2025

The EUR/USD pair saw no change on Friday. There was no news background in the direct sense of the word today, so the market had nothing to respond

Chin Zhao 18:39 2025-03-21 UTC+2

Analysis for EUR/USD on March 20, 2025

The wave structure on the 4-hour chart for EUR/USD is at risk of transforming into a more complex formation. A new downtrend structure started forming on September 25, which took

Chin Zhao 18:37 2025-03-20 UTC+2

GBP/USD Analysis – March 18th

The wave structure for GBP/USD remains somewhat ambiguous yet generally clear. At present, there is a high probability that a long-term downward trend is forming. Wave 5 has taken

Chin Zhao 18:45 2025-03-18 UTC+2

EUR/USD Analysis – March 18th

The wave structure on the four-hour chart is at risk of transforming into a more complex formation. A new downward wave structure began forming on September 25, taking the shape

Chin Zhao 18:43 2025-03-18 UTC+2

EUR/USD Analysis – March 17th

The 4-hour wave analysis for EUR/USD is at risk of transforming into a more complex structure. A new downward trend began on September 25, taking the form of a five-wave

Chin Zhao 17:34 2025-03-17 UTC+2
Can't speak right now?
Ask your question in the chat.
Widget callback
 

Dear visitor,

Your IP address shows that you are currently located in the USA. If you are a resident of the United States, you are prohibited from using the services of InstaFintech Group including online trading, online transfers, deposit/withdrawal of funds, etc.

If you think you are seeing this message by mistake and your location is not the US, kindly proceed to the website. Otherwise, you must leave the website in order to comply with government restrictions.

Why does your IP address show your location as the USA?

  • - you are using a VPN provided by a hosting company based in the United States;
  • - your IP does not have proper WHOIS records;
  • - an error occurred in the WHOIS geolocation database.

Please confirm whether you are a US resident or not by clicking the relevant button below. If you choose the wrong option, being a US resident, you will not be able to open an account with InstaForex anyway.

We are sorry for any inconvenience caused by this message.