Analysis of GBP/USD 5M
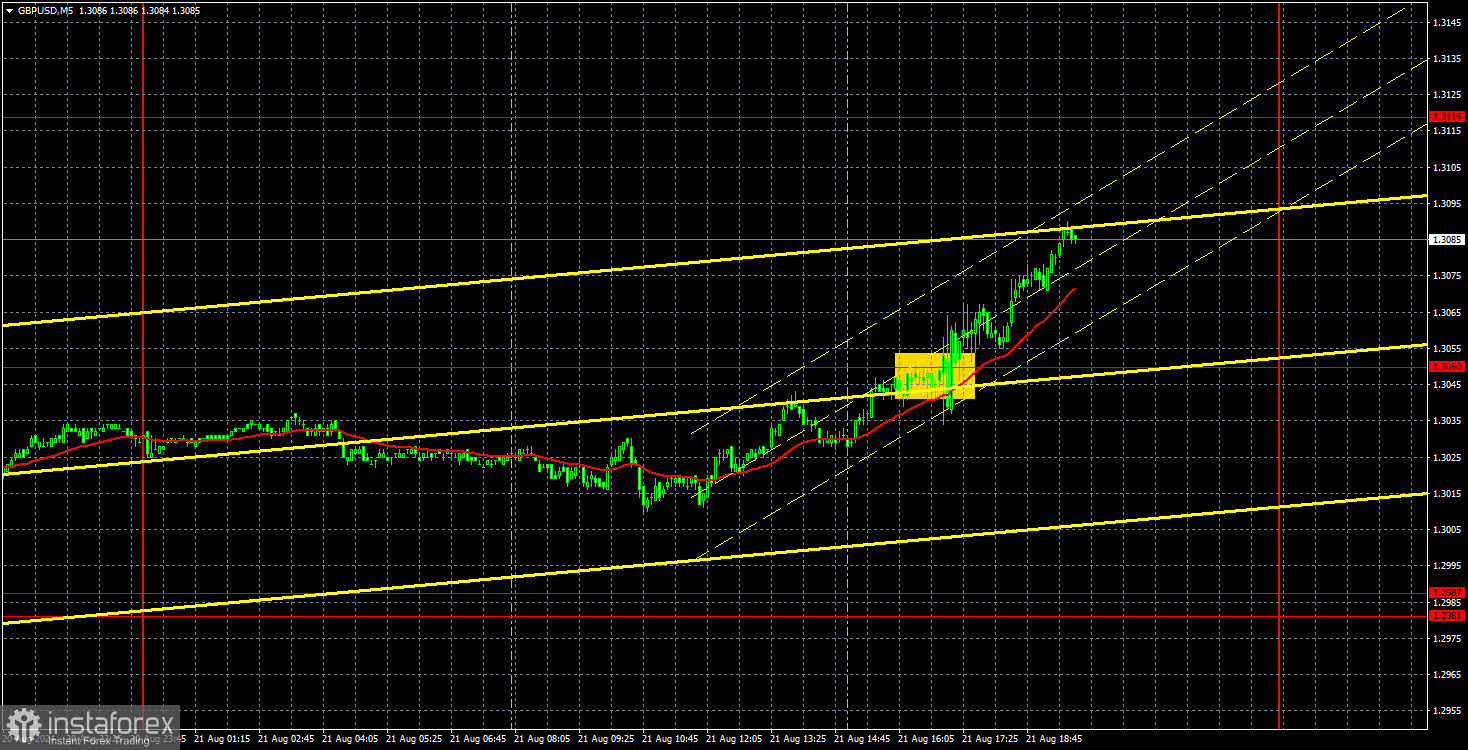
The GBP/USD pair continued its upward movement on Wednesday, not even attempting a downward correction. The idea of a correction seems out of the question. Thus, the pound sustains its illogical rise. The price has bounced slightly off the 1.3050 level, but neither a pullback nor a correction has been observed. The market continues to buy the pound and sell the dollar, even without fundamental or macroeconomic factors or using formal reasons.
As previously mentioned, any movement in the pair can always be explained post facto. Federal Reserve Chairman Jerome Powell is set to speak on Friday, with the market anticipating only dovish rhetoric. Bank of England Governor Andrew Bailey will also speak on Friday, with no hints of a rate cut expected at the next meeting. The annual Nonfarm Payrolls adjustment report, published on Wednesday, was worse than forecasts, leaving the dollar with no apparent option but to decline. But declines come in different forms. The current situation is not just a decline; it's a total collapse, with no clear reasons for such a drastic shift.
On Wednesday, only one trading signal was formed. During the U.S. trading session, the price broke through the 1.3050 level and continued toward the next level of 1.3119. The long position could have been closed in the evening, but it can also remain open. There is no difference, as we observe movement in only one direction.
COT report:
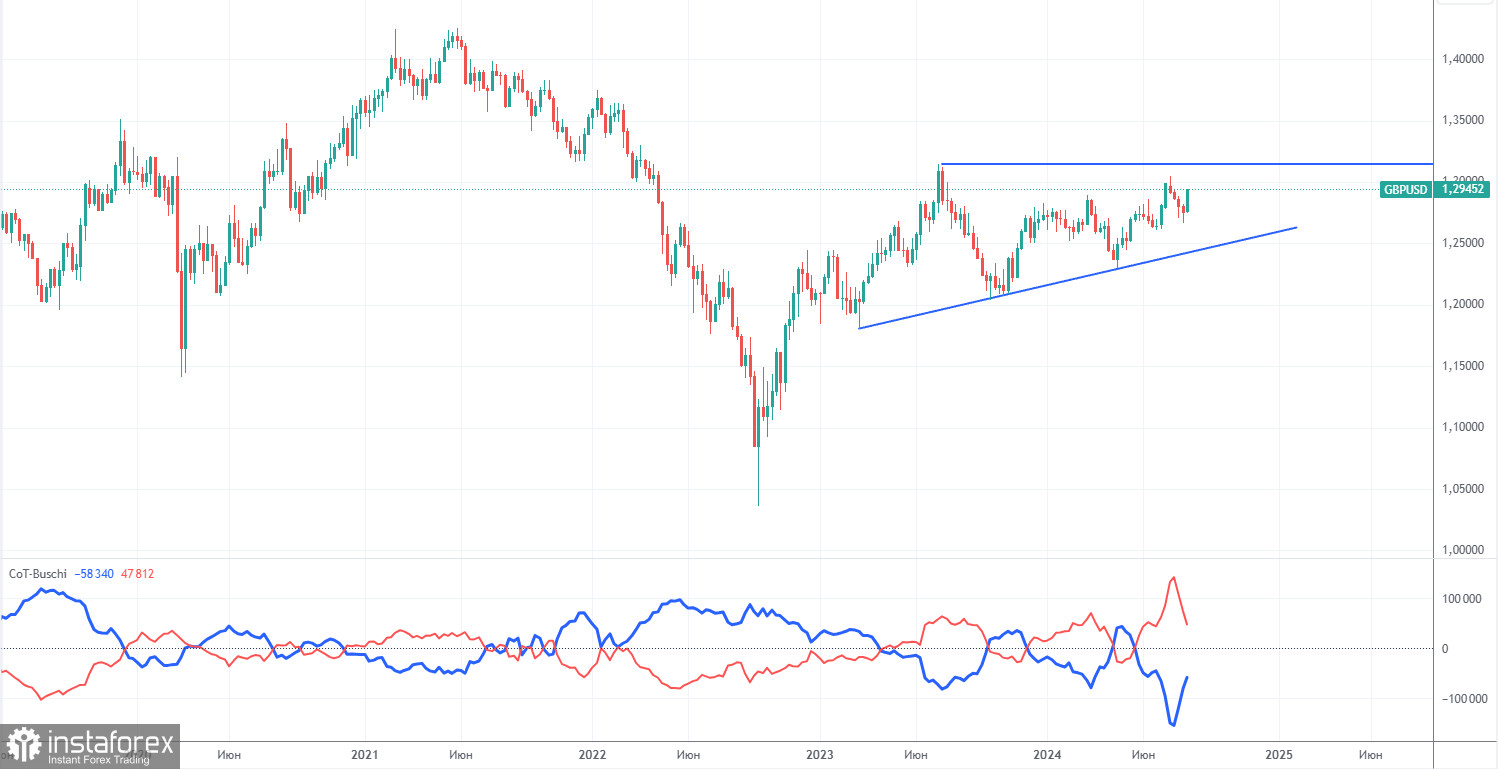
COT reports for the British pound indicate that the sentiment among commercial traders has been constantly changing in recent years. The red and blue lines, representing the net positions of commercial and non-commercial traders, constantly intersect and are often close to the zero mark. According to the latest report on the British pound, the non-commercial group closed 23,500 buy contracts and opened 3,100 short ones. As a result, the net position of non-commercial traders decreased by another 26,600 contracts over the week and continues to fall rapidly. Yet the pound continues to rise calmly.
The fundamental background still does not provide any grounds for long-term purchases of the pound sterling, and the currency has a real chance to resume the global downward trend. However, an ascending trend line formed in the weekly time frame. Therefore, a long-term decline in the pound is unlikely unless the price breaches this trend line. Despite almost everything, the pound continues to rise. Even when COT reports show that major players are selling the pound, it continues to rise. The parade of paradoxes continues.
Analysis of GBP/USD 1H
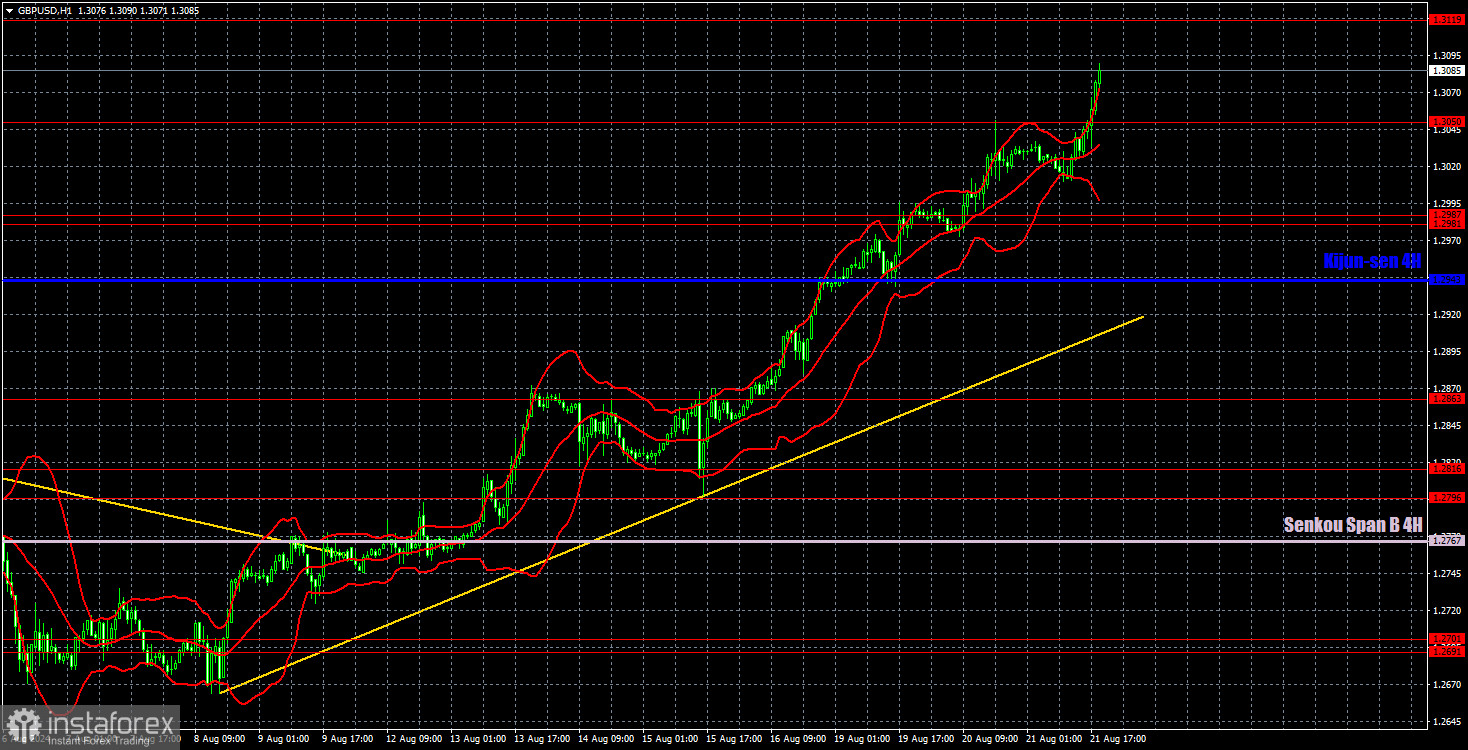
In the hourly chart, GBP/USD continues its uninterrupted upward movement. A decline is the only logical and predictable scenario in the medium term when considering all factors: technical, fundamental, and macroeconomic. However, the market buys pounds and sells dollars daily, disregarding the lack of corrections or news on specific days. Even minor reports are interpreted in favor of the pound, leaving the dollar with no chance. This trend is not due to macroeconomics but also the market's reluctance to buy the dollar.
For August 22, we highlight the following important levels: 1.2429-1.2445, 1.2516, 1.2605-1.2620, 1.2691-1.2701, 1.2796-1.2816, 1.2863, 1.2981-1.2987, 1.3050, 1.3119. The Senkou Span B (1.2767) and Kijun-sen (1.2943) lines can also serve as sources of signals. Setting the Stop Loss to break even when the price moves in the intended direction by 20 pips is recommended. The Ichimoku indicator lines may shift during the day, which should be considered when determining trading signals.
On Thursday, the UK will release business activity indices for the services and manufacturing sectors. In the U.S., these reports will be published along with jobless claims. There is hope that the current uptrend in the pair will at least slow down somewhat, though there are few expectations ahead of Powell's speech on Friday.
Explanation of illustrations:
Support and resistance levels: Thick red lines near which the trend may end.
Kijun-sen and Senkou Span B lines: These Ichimoku indicator lines, transferred from the 4-hour timeframe to the hourly chart, are strong lines.
Extreme levels: Thin red lines from which the price previously bounced. These provide trading signals.
Yellow lines: Trend lines, trend channels, and other technical patterns.
Indicator 1 on COT charts: The net position size for each category of traders.