empty
 
 
09.10.2024 12:22 PM
EUR/USD. October 9th. The FOMC Minutes May Support the Dollar

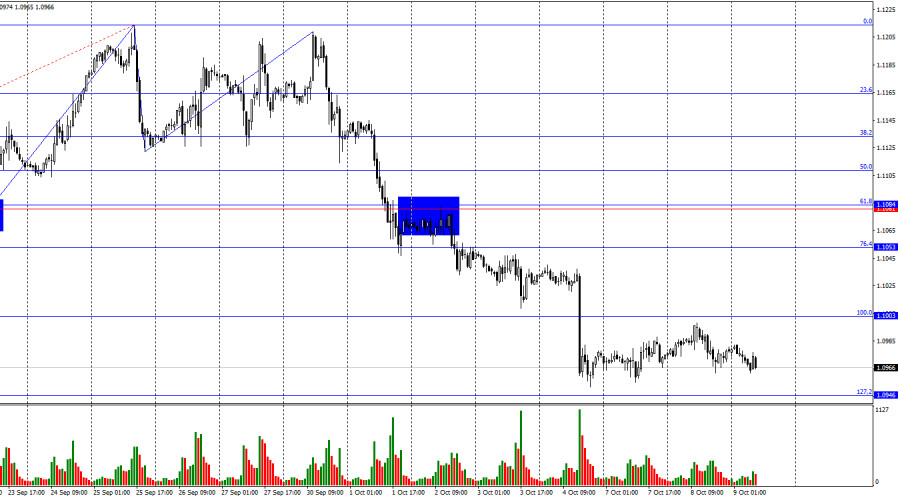
On Tuesday, the EUR/USD pair turned in favor of the U.S. dollar and began a new downward movement toward the 127.2% corrective level at 1.0946. A rebound of the pair from this level would favor the euro and lead to some growth toward the 100.0% Fibonacci level at 1.1003. A close below 1.0946 would increase the likelihood of continued decline toward the next corrective level of 161.8% at 1.0873.

This image is no longer relevant

The wave situation has become more complex in recent weeks, but overall, the trend remains clear. The last completed upward wave (September 25-30) did not break the previous wave's peak, while the new downward wave broke the lows of the previous three waves. As a result, the pair has now started forming a new bearish trend. In the near term, we may see a corrective wave, but the bulls have already lost their market initiative.

The news flow on Tuesday was very weak. Germany released an industrial production report showing a 2.9% month-on-month increase, compared to the market's expectation of +0.8%. However, this report did not impress the market, which remains fully focused on the U.S. inflation report and its impact on the FOMC's monetary policy. It is worth noting that the Consumer Price Index is due tomorrow, which is expected to drop to 2.3%. Core inflation is forecasted at 3.2%, the same as in August. However, a new (even slight) slowdown in inflation will indicate to the Fed that its policy easing path is on track. The dollar has been strengthening confidently in recent weeks, as the market had priced in the first easing of monetary policy for much of the year. As soon as the Fed cut the rate, the opposite effect occurred—the dollar didn't fall; it rose. Today, the FOMC meeting minutes will also be released. If most Committee members express the need for a 0.25% rate cut in November, this could further support the bears. It is noteworthy that the dollar fell on "dovish" expectations of 5-6 rate cuts in 2024.

This image is no longer relevant

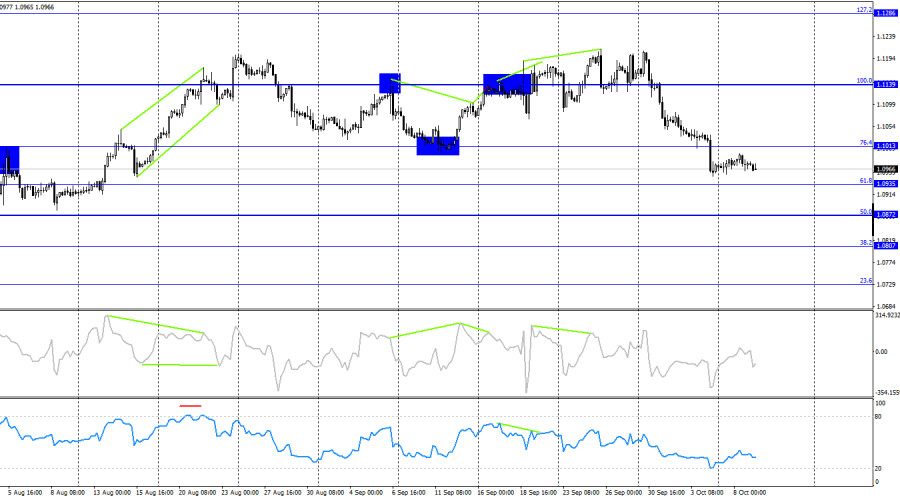
On the 4-hour chart, the pair turned in favor of the U.S. dollar following a series of bearish divergences in the RSI and CCI indicators. RSI also moved into the overbought zone a few weeks ago. A close below 1.1013 indicates a continued decline toward the levels of 1.0935 and 1.0872. No emerging divergences are observed on any indicators today.

Commitments of Traders (COT) Report:

This image is no longer relevant

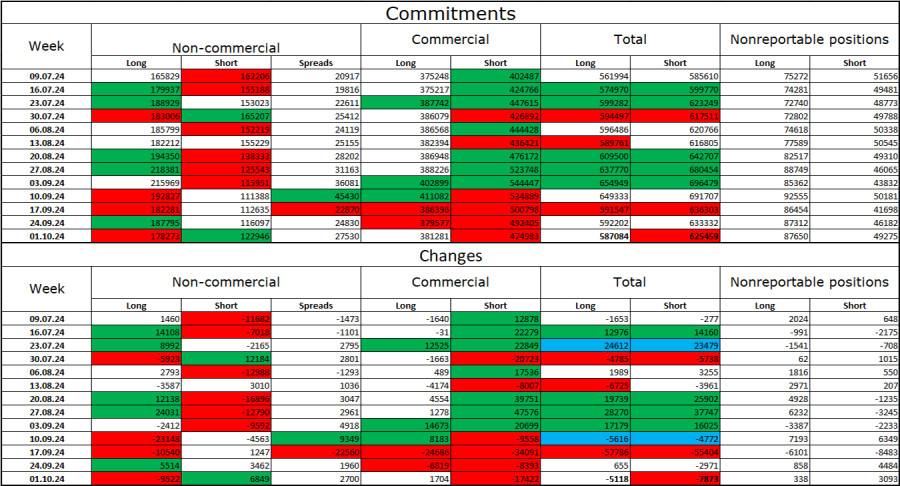
During the last reporting week, speculators closed 9,522 long positions and opened 6,849 short positions. The sentiment of the "Non-commercial" group turned bearish a few months ago, but currently, the bulls are dominating again. The total number of long positions held by speculators is now 178,000, while short positionsamount to only 123,000.

However, for the fourth consecutive week, large players have been selling off the euro. In my opinion, this could signal the start of a new bearish trend or at least a correction. The key factor for the dollar's decline—expectations of the FOMC easing monetary policy—has already been priced in, and the dollar has no more reasons to fall. They might appear over time, but for now, the dollar's rise is more likely. Technical analysis also points to the beginning of a bearish trend. Therefore, I am preparing for a prolonged decline in the EUR/USD pair.

News Calendar for the US and Eurozone:

US – Publication of the FOMC minutes (18:00 UTC).

On October 9, the economic calendar contains only one entry. FOMC minutes often have limited impact on the market, but they will still attract attention. Thus, the influence on traders' sentiment today is likely to occur only in the evening.

Forecast for EUR/USD and Trading Tips:

Selling the pair was possible with a close below 1.1139 on the 4-hour chart, with targets of 1.1081, 1.1070, 1.1013, and 1.0984. All targets have been achieved. I would not rush into new sales—there are no signals yet. Buying the pair is possible today with a rebound on the hourly chart from the support zone of 1.0929–1.0946, with targets of 1.1003 and 1.1053.

Fibonacci levels are plotted between 1.1003 and 1.1214 on the hourly chart and 1.1139 and 1.0603 on the 4-hour chart.

Samir Klishi,
Analytical expert of InstaForex
© 2007-2024
Earn on cryptocurrency rate changes with InstaForex
Download MetaTrader 4 and open your first trade
  • Grand Choice
    Contest by
    InstaForex
    InstaForex always strives to help you
    fulfill your biggest dreams.
    JOIN CONTEST
  • Chancy Deposit
    Deposit your account with $3,000 and get $6000 more!
    In December we raffle $6000 within the Chancy Deposit campaign!
    Get a chance to win by depositing $3,000 to a trading account. Having fulfilled this condition, you become a campaign participant.
    JOIN CONTEST
  • Trade Wise, Win Device
    Top up your account with at least $500, sign up for the contest, and get a chance to win mobile devices.
    JOIN CONTEST
  • 100% Bonus
    Your unique opportunity to get a 100% bonus on your deposit
    GET BONUS
  • 55% Bonus
    Apply for a 55% bonus on your every deposit
    GET BONUS
  • 30% Bonus
    Receive a 30% bonus every time you top up your account
    GET BONUS

Recommended Stories

Can't speak right now?
Ask your question in the chat.
Widget callback