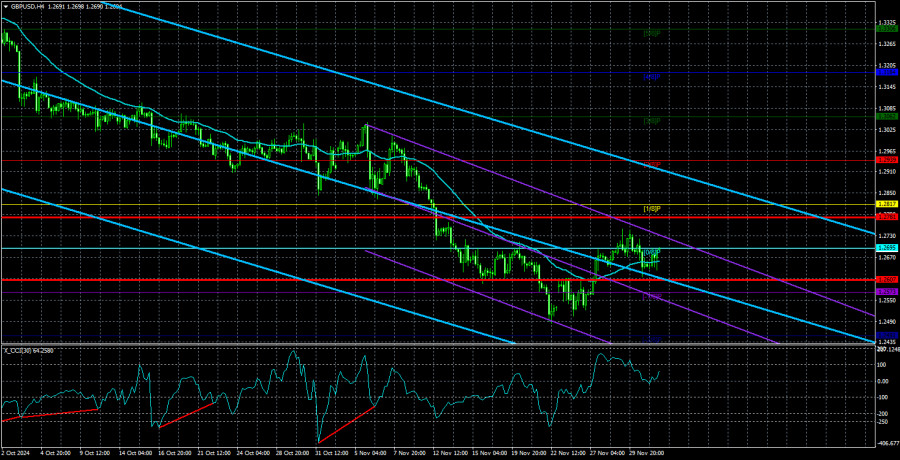
On Tuesday, the GBP/USD pair did not show dramatic movements, but the most notable point is that it hardly rises. We observed a slight correction after two months of decline in the British currency, but the entire drop doesn't even fit on the chart, while the correction is minimal. This suggests that the market has no intention of staying in a corrective phase for long. If the U.S. macroeconomic backdrop this week turns out strong, the pound could collapse again, as it remains overbought and unjustifiably expensive—just like the euro, a point we've been making since early 2024.
An additional factor supporting the dollar could be the Federal Reserve. Recall that the market has priced in the entire or nearly the whole easing cycle over the past two years as U.S. inflation slowed. It must begin pricing in the Bank of England's monetary policy easing, which has barely started. This leaves us with the following: The pound sterling is overvalued, and the market has yet to factor in rate cuts in the UK. The Bank of England has not yet meaningfully started lowering rates. From our perspective, the pound will only continue to decline.
Not only has the market already priced in the entire easing cycle, but it now appears that the Fed might lower rates far less aggressively than previously expected. The Fed is wary of Donald Trump, who is already promising to impose tariffs on any country he sees on the world map. This would likely result in retaliatory tariffs against the U.S., as no country will quietly endure such actions. Consequently, U.S. prices would also rise, triggering renewed inflation. The Fed would then have to either lower rates less aggressively or raise them again to combat high inflation. However, the market has already factored in the "Joe Biden scenario," where no new tariffs are introduced, and everything remains calm and stable.
The longer this situation persists, the stronger the case for further dollar growth. The Bank of England, meanwhile, is only providing temporary support to the pound. It's worth remembering that the Bank's current indecision will eventually lead to aggressive easing. The BoE fears inflation for different reasons, and once it takes more active measures, the pound could start falling much faster. Alternatively, the BoE might adopt a prolonged rate-cutting approach, resulting in a slower but extended decline for the pound.
The pound will continue moving south no matter how you look at it. The 16-year downward trend remains intact, and there are still no solid grounds to expect significant growth in the British currency.
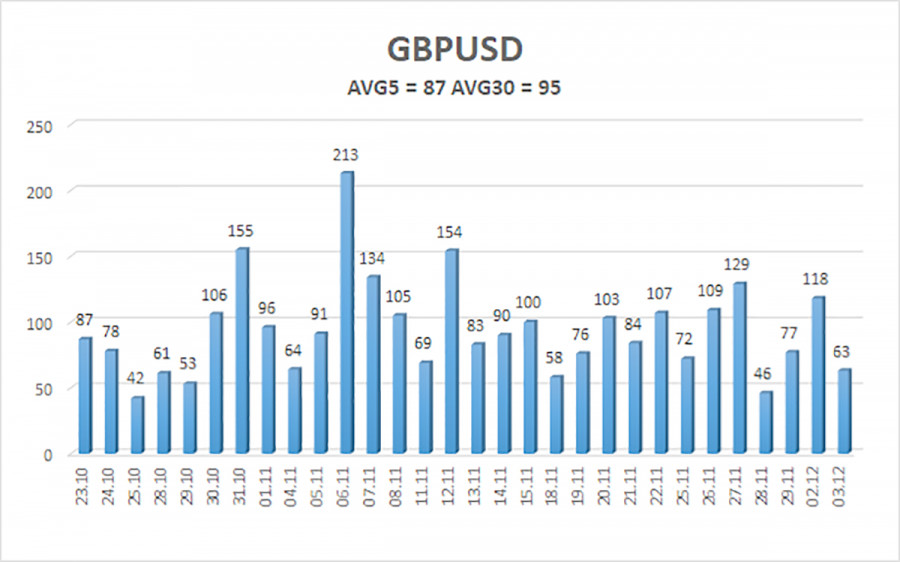
The average volatility of the GBP/USD pair over the last five trading days is 87 pips, considered "average" for the pair. On Wednesday, December 4, we expect movement within the range defined by 1.2607 and 1.2781. The higher linear regression channel is pointing downward, signaling a bearish trend. The CCI indicator has formed multiple bullish divergences and has entered the oversold zone several times. A correction has started, but its strength is difficult to predict.
Nearest Support Levels:
Nearest Resistance Levels:
- R1: 1.2695
- R2: 1.2817
- R3: 1.2939
Trading Recommendations:
The GBP/USD pair maintains a bearish trend. We still do not recommend long positions, as we believe the market has already priced in all factors that could support the British currency multiple times. If trading is based purely on "technical analysis," long positions are possible with targets at 1.2781 and 1.2817 if the price is above the moving average. However, short positions are far more relevant now, with a target of 1.2451, should the price fall below the moving average.
Explanation of Illustrations:
Linear Regression Channels help determine the current trend. If both channels are aligned, it indicates a strong trend.
Moving Average Line (settings: 20,0, smoothed) defines the short-term trend and guides the trading direction.
Murray Levels act as target levels for movements and corrections.
Volatility Levels (red lines) represent the likely price range for the pair over the next 24 hours based on current volatility readings.
CCI Indicator: If it enters the oversold region (below -250) or overbought region (above +250), it signals an impending trend reversal in the opposite direction.


