GBP/USD 5-Minute Analysis
The GBP/USD currency pair also traded higher on Thursday, appreciating more strongly than the euro. Despite a nearly absent and identical macroeconomic backdrop, the pound sterling continues to rise, while the euro remains relatively stagnant. This dynamic does not surprise us, as we have repeatedly mentioned that the British currency demonstrates greater resistance against the dollar. In other words, it tends to rise more readily than the euro and fall more reluctantly. However, the overarching trend remains unchanged. The euro and the pound are correcting within a downward trend that began 2.5 months ago.
Thus, we expect the current correction to end and the downward movement to resume. We had warned that the corrections might be lengthy, slow, and complex. There is no guarantee they will conclude anytime soon. Today, significant U.S. data releases could strengthen the U.S. dollar. However, strengthening within a day does not necessarily mean the correction is over. Secondly, a new decline could begin after a rise in the dollar. Thirdly, the U.S. labor market and unemployment data are not guaranteed to be strong.
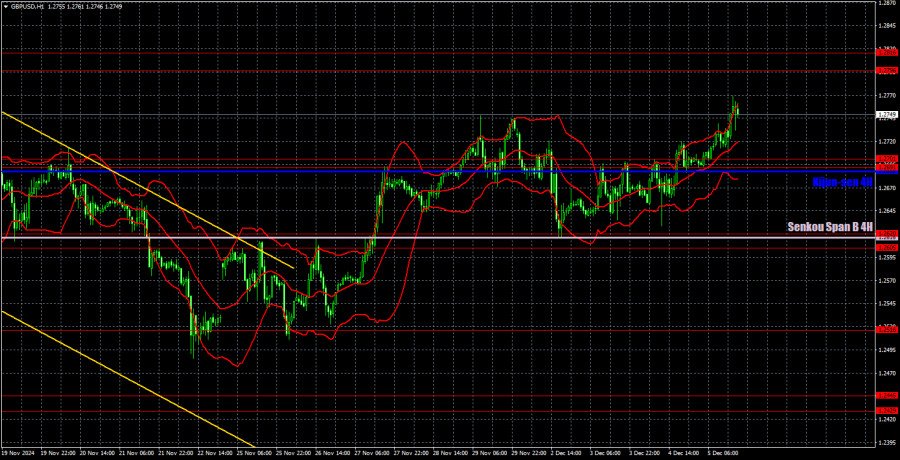
Yesterday, only one trading signal was formed, but it was reasonably effective. Early in the European trading session, the price rebounded from the 1.2691–1.2701 area and subsequently increased by about 40–50 pips. Traders could have captured these points if they manually closed their positions in the evening. Long positions could also remain open, as further growth is possible today. However, we caution against taking such risks before key U.S. data releases.
COT Report
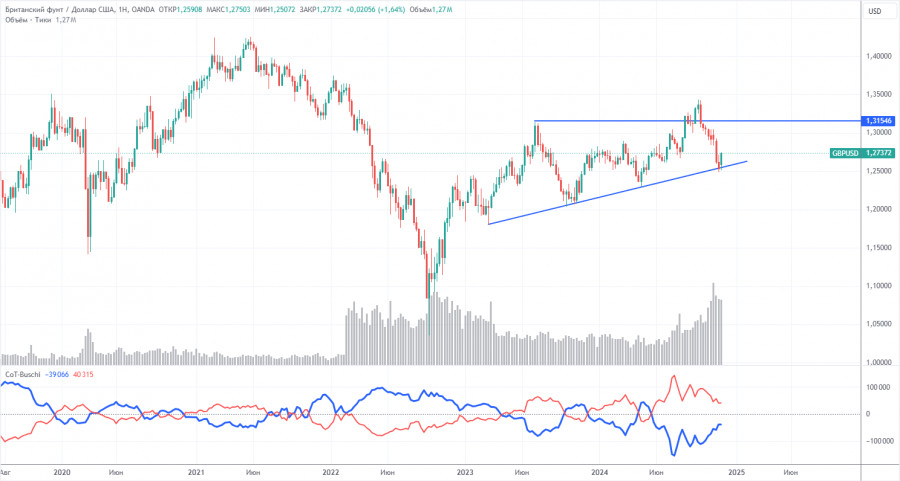
The COT reports for the British pound show that sentiment among commercial traders has frequently shifted in recent years. The red and blue lines, representing the net positions of commercial and non-commercial traders, often cross and mostly remain close to the zero mark. The recent downward trend occurred when the red line was below zero. The red line is above zero, while the price has breached the key 1.3154 level.
According to the latest report on the British pound, the Non-commercial group closed 18,300 BUY contracts and 2,500 SELL contracts. Thus, the net position of Non-commercial traders decreased by another 15,800 contracts during the week.
The fundamental backdrop still does not justify long-term purchases of the British pound, and the currency has a real chance of resuming a global downtrend. On the weekly timeframe, there is an ascending trendline. Until this line is broken, a long-term decline in the pound is unlikely. While the pound has tested this trendline, it hasn't yet consolidated below it. A rebound and correction could occur in the long term, but we believe the line will eventually be breached, and the downtrend will continue.
GBP/USD 1-Hour Analysis
The GBP/USD pair maintains a bearish outlook on the hourly timeframe, yet it continues to correct upward. We still do not see any fundamental reasons for the pound sterling to rise apart from the technical necessity of periodic corrections. However, the pound's remarkable resistance once again plays in its favor. The pound sterling is rising again, even as the euro remains stagnant.
For December 6, we highlight the following important levels: 1.2429-1.2445, 1.2516, 1.2605-1.2620, 1.2796-1.2816, 1.2863, 1.2981-1.2987, 1.3050. Senkou Span B (1.2616) and Kijun-sen (1.2688) lines can also be sources of signals. A Stop Loss is recommended to be set at breakeven once the price moves 20 pips in the desired direction. Note that the Ichimoku indicator lines may shift during the day, so adjustments may be needed when interpreting signals.
No significant events are scheduled in the UK on Friday. However, the U.S. will release four noteworthy reports, three of which will be published simultaneously. This could result in strong momentary market reactions. The most critical reports are on non-farm payrolls and the unemployment rate. For the dollar to strengthen, these figures need to surpass official forecasts.
Illustration Explanations:
- Support and Resistance Levels (thick red lines): Key areas where price movement might stall. Not sources of trading signals.
- Kijun-sen and Senkou Span B Lines: Ichimoku indicator lines transferred from the H4 timeframe to the hourly chart, serving as strong levels.
- Extreme Levels (thin red lines): Points where the price has previously rebounded. They can serve as trading signal sources.
- Yellow Lines: Trendlines, channels, or other technical patterns.
- Indicator 1 on COT Charts: Reflects the net position size of each trader category.


