empty
10.11.2021 07:25 PM
Bitcoin soars to $69,000: what caused the bullish rally and what do BTC technical indicators say?

After a local decline provoked by profit-taking by long-term owners, bitcoin began to grow again and as of 13:30 UTC set a new ATH at $69,000. Despite the fact that the current growth is associated with fundamental reasons and it is extremely dangerous to trade now, there is an opportunity to catch an asset on the decline after a bullish rally. To do this, it is necessary to analyze the horizontal charts of the coin and understand the reasons for such a sharp increase in the price of the cryptocurrency.

The main reason for such a sudden growth of bitcoin was the Fed's report on the rate of inflation. According to the latest data, inflation in the United States has exceeded 6.2%, which is a record for the last thirty years. This news served as a signal for action and investors began to buy BTC, as the depreciation of fiat suggests that the demand for a cryptocurrency that protects against it will grow. Thanks to this, the coin has confidently overcome all resistance levels and continues to grow.

It is worth noting that in order to avoid unforeseen losses, it is necessary to monitor the financial calendar of volatility and refrain from trading at the moments of important financial events. The current bitcoin rally is out of the picture and is an impulsive reaction to new objective data. To make sure of this and to predict the point of price decline, it is necessary to analyze different time periods of price movement.

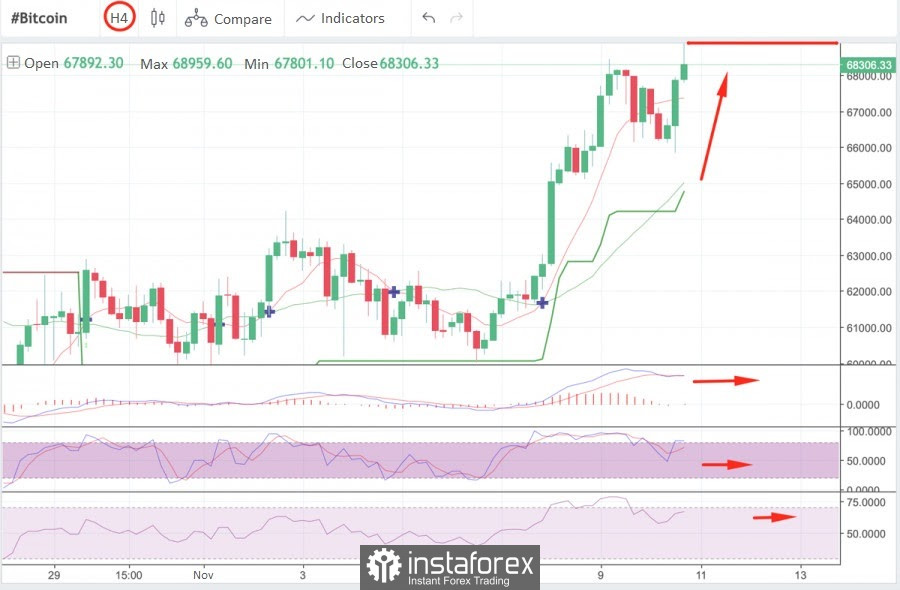
The four-hour chart shows that the first cryptocurrency has made a rebound from the $65,800 area, which can be seen by the long lower wick of the green candle. This suggests that the sellers failed to push the price below the support line, as a result of which the quotes rebounded and began to grow. At the same time, US inflation data were announced, which gave an additional upward impulse to the bullish wave.

Despite the fact that bitcoin has set a new historical record, the prerequisites for further decline are already visible. This can be seen by the long upper tail of the last bullish candle, which means the pressure of sellers who pushed the price down to $68,200. Now the cryptocurrency is trying to resume the upward movement by retesting the $68,200 resistance zone.

The technical charts of Bitcoin begin to signal the weakening of the current bullish momentum: the MACD is moving sideways, and the stochastic is beginning to decline, which indicates the loss of initiative by buyers. The relative strength index also shows a tendency to sideways movement, but is in a bullish zone. Taking into account the long upper wick on the last candle, the positions of bulls and bears are approximately equal, which means that the movement can go in any direction.

This image is no longer relevant

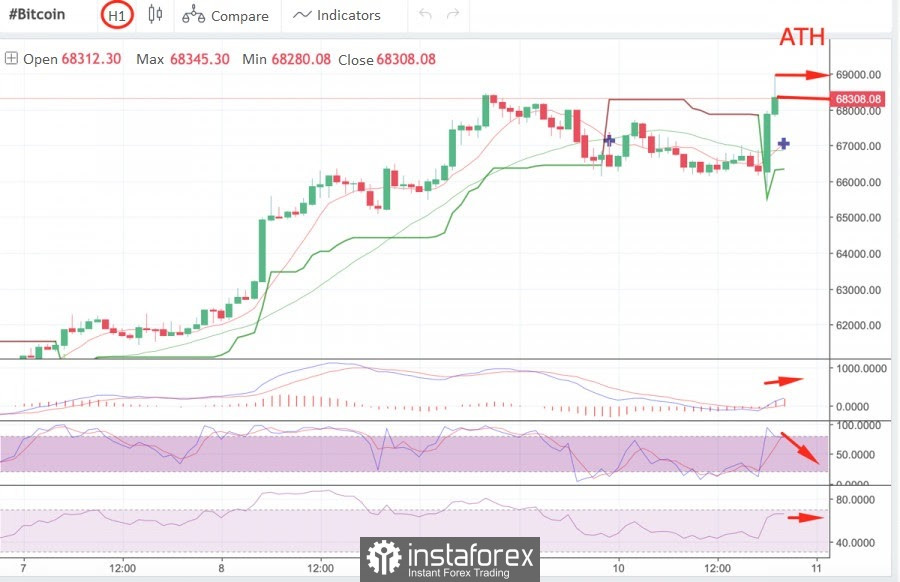
On the hourly chart, the situation also looks unstable, but the bears' positions look more confident. After reaching ATH, bitcoin failed to overcome the $68,200 mark, which means that the resistance zone still maintains pressure on the quotes.

With this in mind, the $68,200 mark is an excellent entry zone for a decline, but less than an hour has passed since the Fed's conclusion, which indicates an increased risk of opening short right now.

The instability of the situation is clearly visible on the technical charts: the stochastic oscillator confidently moved upside and subsequently made a sharp pullback, but has already begun to level off. At the same time, the relative strength index began a sideways movement in the bullish zone, which indicates the strength of the upward momentum. While the MACD moves along the red zone and begins a broad bullish ascent beyond the zero mark, which indicates a new impulse to growth.

This image is no longer relevant

The price met serious resistance in the area of $68,200-$68,300 and, most likely, buyers will try to push the price to the historical maximum, but subsequently, a strong corrective decline will begin, and therefore it is worth waiting for the situation to stabilize.

At the start of the downward movement, the $68,200 mark will be a profitable entry point, but it will not be superfluous to hedge around $68,345 with a stop loss. The price drop will slow down around $66,700-$67,600, but if you exit this range, you can continue to play down to the key support level at $64,400.

Artem Petrenko,
Analytical expert of InstaForex
© 2007-2025
Select timeframe
5
min
15
min
30
min
1
hour
4
hours
1
day
1
week
Earn on cryptocurrency rate changes with InstaForex
Download MetaTrader 4 and open your first trade
  • Grand Choice
    Contest by
    InstaForex
    InstaForex always strives to help you
    fulfill your biggest dreams.
    JOIN CONTEST

Recommended Stories

Bitcoin Forecast for May 23, 2025

On Thursday, Bitcoin's price reached the target level of 111,770. The Marlin oscillator appears to be lagging behind the price, giving the impression of a potential divergence — though unconventional

Laurie Bailey 04:45 2025-05-23 UTC+2

Bitcoin aims to hit $120,000? What lies behind its rally and when to expect retracement

On May 22, Bitcoin confidently broke through the $111,888 level, setting a new all-time high of $111,867. Unlike previous rallies marked by retail investor euphoria, this time the market's behavior

Ekaterina Kiseleva 16:12 2025-05-22 UTC+2

Bitcoin extending confident rally

Bitcoin demand appears to be surging, judging by its recent performance. At the time of publication, the BTC/USD pair was trading near 111,200.00, slightly down from today's and the all-time

Jurij Tolin 16:02 2025-05-22 UTC+2

Bitcoin: $115,000 — Next Stop or Bull Trap?

Bitcoin is steadily approaching its all-time high and, according to several analysts, is poised to set a new record. Current levels near $105,000 are more than just numbers — they

Ekaterina Kiseleva 00:58 2025-05-21 UTC+2

BTC/USD Analysis on May 20, 2025

The wave pattern on the 4-hour chart for BTC/USD has been becoming more complex in recent months. We observed a corrective downward structure, which completed its formation around the 75,000

Chin Zhao 11:11 2025-05-20 UTC+2

Technical Analysis of Daily Price Movement of Ethereum Cryptocurrency, Friday May 16, 2025.

If we look at the 4-hour chart, the Ethereum cryptocurrency appears to be moving above the WMA (21) which is a dynamic support where the WMA has a slope that

Arief Makmur 06:09 2025-05-16 UTC+2

Technical Analysis of Intraday Price Movement of Uniswap Cryptocurrency, Friday May 16, 2025.

On the 4-hour chart, the Uniswap cryptocurrency appears to have a Descending Broadening Wedge pattern, so even though the Uniswap price movement is moving below the WMA (21) which

Arief Makmur 06:09 2025-05-16 UTC+2

Bitcoin spikes from $96 600 to $104 500 in 24 hours

Bitcoin has surged to $104,500, after trading at $96,600 just yesterday morning. This confident move above the $100,000 mark clearly signals a return of strong bullish momentum in the cryptocurrency

Jakub Novak 14:49 2025-05-09 UTC+2

Trading Recommendations for the Cryptocurrency Market on May 9

Bitcoin has climbed above $100,000, while Ethereum is trying to consolidate above $2,000. After yesterday's sharp rally, which continued during today's Asian session, Bitcoin is now trading at $103,000, having

Miroslaw Bawulski 09:46 2025-05-09 UTC+2

Technical Analysis of Intraday Price Movement Ethereum Cryptocurrency, Friday May 09, 2025.

If we look at the 4-hour chart of the Ethereum cryptocurrency, it appears that the price movement is moving above the WMA (30 Shift 2) which also has a slope

Arief Makmur 06:27 2025-05-09 UTC+2
Can't speak right now?
Ask your question in the chat.
Widget callback
 

Dear visitor,

Your IP address shows that you are currently located in the USA. If you are a resident of the United States, you are prohibited from using the services of InstaFintech Group including online trading, online transfers, deposit/withdrawal of funds, etc.

If you think you are seeing this message by mistake and your location is not the US, kindly proceed to the website. Otherwise, you must leave the website in order to comply with government restrictions.

Why does your IP address show your location as the USA?

  • - you are using a VPN provided by a hosting company based in the United States;
  • - your IP does not have proper WHOIS records;
  • - an error occurred in the WHOIS geolocation database.

Please confirm whether you are a US resident or not by clicking the relevant button below. If you choose the wrong option, being a US resident, you will not be able to open an account with InstaForex anyway.

We are sorry for any inconvenience caused by this message.