To open long positions on GBP/USD, you need:
The British pound did not manage to get above the upper border of the horizontal channel in the first half of the day, and then completely collapsed after the speech of the Federal Reserve chairman, who announced a more active curtailment of the bond purchasing program this and next year. Volatility was quite high and against this background there were many signals to enter the market. Let's take a look at the 5 minute chart and figure out the points. In my morning forecast, I paid attention to the 1.3330 level and advised how best to deal with it. A breakthrough and consolidation above 1.3330 with a reverse test from top to bottom - all this led to the formation of an excellent entry point into long positions with the goal of rising to the 1.3361 area, where I advised to take profits. The growth was about 30 points. Bears began to be more active at 1.3361, which, after a false breakout, led to the formation of a good entry point for short positions. As a result, the pair returned back to 1.3327, allowing another 30 points to be pulled out of the market. In the afternoon, one could again observe the bulls' desperate attempt to return to the market and the next formation of a false breakout at 1.3327, which led to a signal to sell the pound and its collapse by more than 160 points.
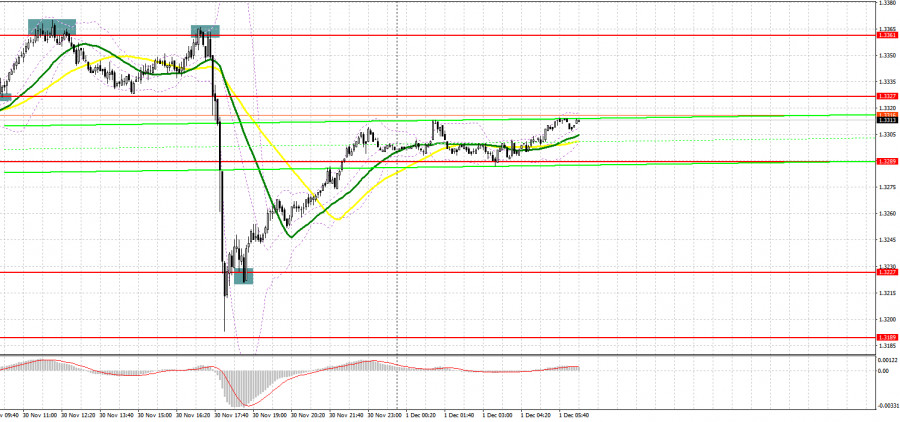
This morning we are waiting for the PMI for the UK manufacturing sector for November this year, but the speech of Bank of England Governor Andrew Bailey will be much more interesting, who continues to adhere to a soft monetary policy, which does not allow the pound to "spread its wings." A breakthrough of 1.3331 is required in order for the pound to continue rising. A downward test of this level will lead to the formation of a buy signal with the prospect of stopping yesterday's bearish impulse and GBP/USD recovery to the 1.3362 area, which is still the upper border of the horizontal channel. If the bulls do not stop and quickly deal with this level, the next target will be the 1.3389 high, where I recommend taking profits. The next target is the resistance at 1.3417. In case the pound falls during the European session, after a weak report on the manufacturing sector, I advise you to open new long positions only after protecting the lower boundary of the horizontal channel at 1.3288, below which the pound is in great demand. Formation of a false breakout there will be an excellent entry point into the market. I advise you to open long positions immediately on a rebound only from the 1.3254 low, or even lower - around 1.3224, counting on a correction of 20-25 points within the day.
To open short positions on GBP/USD, you need:
Yesterday's bearish momentum ended very quickly and today we need to try very hard to prevent the pair from returning to the upper border of the horizontal channel. For now, bears should not panic, and all that is required of them is to protect the resistance at 1.3331. Formation of a false breakout at this level, to which bulls are now trying to return the pound, will lead to the formation of a new entry point to short positions, followed by a decline to the area of the lower border of the horizontal channel at 1.3288, which is very important from a technical point of view. The next breakthrough of this level will create real problems for bulls. A reverse test of 1.3288 from the bottom up will provide an excellent entry point, which will push the pair to new lows: 1.3254 and 1.3224, where I recommend taking profits. The next target will be the support at 1.3196. In case the pair grows during the European session and the bears are not active at 1.3331, it is best to postpone selling until the larger resistance of 1.3362, which also acts as the upper border of the horizontal channel. I also recommend opening short positions there only in case of a false breakout. Selling GBP/USD immediately on a rebound is possible only from a large resistance at 1.3389, or even higher - from a new high in the 1.3417 area, counting on the pair's rebound down by 20-25 points within the day.
I recommend for review:
The Commitment of Traders (COT) reports for November 23 revealed that short positions increased and long positions decreased, which led to an even greater increase in the negative delta. The dovish statements of the Bank of England governor from last week kept the pressure on the British pound, even amid risks associated with higher inflationary pressures than previously expected. The aggravation of the situation with the coronavirus and the new Omicron strain in the European part of the continent did not add optimism. It is also not clear what is with the issue of the Ireland protocol, which the UK authorities are planning to suspend. At the same time, we are witnessing a rise in inflation in the United States of America and increased talk about the need for an earlier increase in interest rates next year, which is providing significant support to the US dollar. However, I recommend sticking to the strategy of buying the pair in case of very large falls, which will occur against the background of uncertainty in the central bank's policy. The COT report indicated that long non-commercial positions declined from 50,443 to 50,122, while short non-commercials rose from 82,042 to 84,701. This led to an increase in the negative non-commercial net position: delta was -34,579 against -31,599 a week earlier. The weekly closing price did not drop that much - from 1.3410 to 1.3397.
Indicator signals:
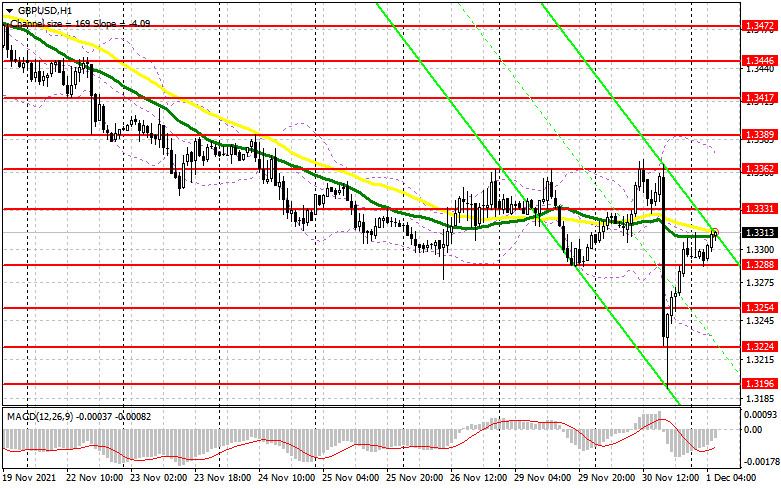
Trading is carried out in the area of 30 and 50 moving averages, which indicates some market uncertainty with direction.
Moving averages
Note: The period and prices of moving averages are considered by the author on the H1 hourly chart and differs from the general definition of the classic daily moving averages on the daily D1 chart.
Bollinger Bands
In case of growth, the upper border of the indicator in the area of 1.3362 will act as a resistance. In case of a decline, support will be provided by the lower border of the indicator in the area of 1.3235.
Description of indicators
- Moving average (moving average, determines the current trend by smoothing out volatility and noise). Period 50. It is marked in yellow on the chart.
- Moving average (moving average, determines the current trend by smoothing out volatility and noise). Period 30. It is marked in green on the chart.
- MACD indicator (Moving Average Convergence/Divergence — convergence/divergence of moving averages) Quick EMA period 12. Slow EMA period to 26. SMA period 9
- Bollinger Bands (Bollinger Bands). Period 20
- Non-commercial speculative traders, such as individual traders, hedge funds, and large institutions that use the futures market for speculative purposes and meet certain requirements.
- Long non-commercial positions represent the total long open position of non-commercial traders.
- Short non-commercial positions represent the total short open position of non-commercial traders.
- Total non-commercial net position is the difference between short and long positions of non-commercial traders.


