empty
06.01.2022 04:28 AM
Forecast and trading signals for EUR/USD for January 6. Detailed analysis of the pair's movement and trade deals. Euro continues to ride on a swing

EUR/USD 5M

This image is no longer relevant

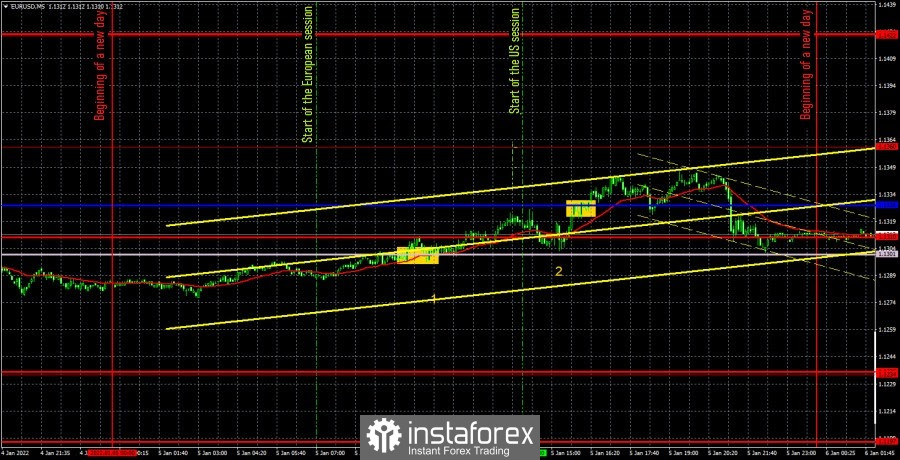
The EUR/USD pair began a new round of upward movement within the same 1.1234-1.1360 horizontal channel on Wednesday. Thus, during the course of the environment, it moved to the upper region of this channel again. However, what will happen this time? Another rebound from the upper border or surpassing and forming a new upward trend? So far, we can only draw one conclusion: the pair continues to trade in a flat. Thus, trading on almost any timeframe is very difficult. The 5-minute chart clearly shows that the intraday movement was trending, but the overall volatility was about 70 points. Not much and not enough. Basically, in recent weeks, the pair has shown a fairly good movement, but still inside the horizontal channel. A more or less important ADP report on changes in the number of workers in the private sector was published in the US yesterday. But despite the fact that the actual value exceeded the forecast almost twice, the US dollar did not receive any support from the markets (figure "2" in the chart). The number "1" marks the time when the index of business activity in the service sector of the European Union was published, which had even less chance of being a proven market. Accordingly, none of the planned reports had any effect on the pair's movement. All that remains is to deal with trading signals. The first of them - to buy - was formed when the pair crossed the Senkou Span B line. Subsequently, the upward movement continued, and the price also crossed the critical line. A sell signal was never formed during the day, so the long position should have been manually closed in the late afternoon. By this time, the price was able to go up 28 points. Also, traders could have had Stop Loss triggered at breakeven for a single deal, since the price dropped back to the Senkou Span B line, but in this case, new longs should have been opened by rebounding from this line (the margin of error is only 1 point).

We recommend you to familiarize yourself:

Overview of the EUR/USD pair. January 6. The market awaits Nonfarms on Friday. The euro expects a weak December value.

Overview of the GBP/USD pair. January 6. Boris Johnson risks leaving his post before the end of this year.

Forecast and trading signals for GBP/USD for January 6. Detailed analysis of the movement of the pair and trade deals.

EUR/USD 1H

This image is no longer relevant

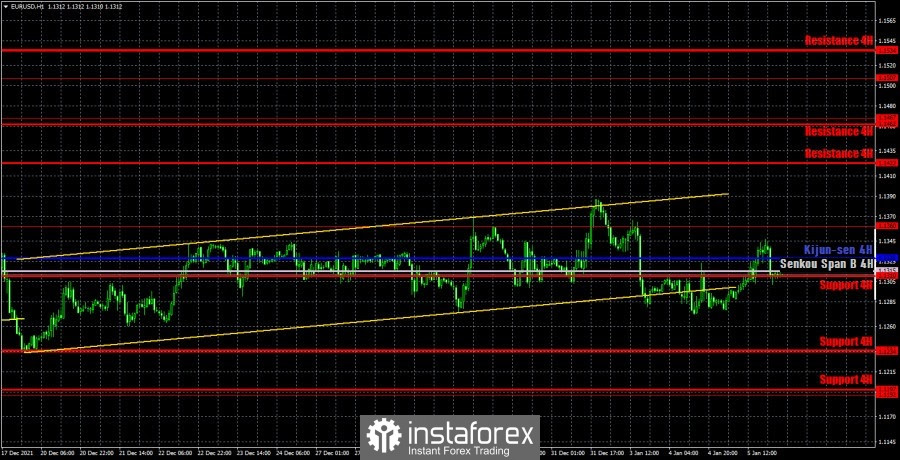
On the hourly timeframe, the pair dropped below the rising channel the day before yesterday, so it was immediately cancelled. But the pair continues to remain inside the horizontal channel, limited by the levels of 1.1234 and 1.1360. At this time, the price is not far from the upper limit of it, but even overcoming it does not guarantee that the euro will continue to rise. The movement is now as horizontal as possible, but with a slight upward slope. There is no clear trend or trend. We allocate the following levels for trading on Thursday - 1.1192, 1.1234, 1.1360, 1.1422, as well as the Senkou Span B (1.1315) and Kijun-sen (1.1328) lines. The lines of the Ichimoku indicator may change their position during the day, which should be taken into account when searching for trading signals. Signals can be "rebounds" and "breakthroughs" of these levels and lines. Do not forget about placing a Stop Loss order at breakeven if the price moves 15 points in the right direction. This will protect you against possible losses if the signal turns out to be false. You should also take into account the fact that flat is very likely now again, so the lines of the Ichimoku indicator are weak. No important report in the European Union on Thursday. Only an absolutely secondary report on applications for unemployment benefits will be released in the US, as well as a more or less important index of business activity in the ISM services sector. It is the only one who can provoke a reaction from traders.

Explanations for the chart:

Support and Resistance Levels are the levels that serve as targets when buying or selling the pair. You can place Take Profit near these levels.

Kijun-sen and Senkou Span B lines are lines of the Ichimoku indicator transferred to the hourly timeframe from the 4-hour one.

Support and resistance areas are areas from which the price has repeatedly rebounded off.

Yellow lines are trend lines, trend channels and any other technical patterns.

Indicator 1 on the COT charts is the size of the net position of each category of traders.

Indicator 2 on the COT charts is the size of the net position for the non-commercial group.

Paolo Greco,
Analytical expert of InstaForex
© 2007-2025
Select timeframe
5
min
15
min
30
min
1
hour
4
hours
1
day
1
week
Earn on cryptocurrency rate changes with InstaForex
Download MetaTrader 4 and open your first trade
  • Grand Choice
    Contest by
    InstaForex
    InstaForex always strives to help you
    fulfill your biggest dreams.
    JOIN CONTEST

Recommended Stories

GBP/USD: Trading Plan for the U.S. Session on May 9th (Morning Trade Review)

In my morning forecast, I highlighted the 1.3283 level and planned to make market entry decisions based on it. Let's look at the 5-minute chart and analyze what happened

Miroslaw Bawulski 19:05 2025-05-09 UTC+2

EUR/USD: Trading Plan for the U.S. Session on May 9th (Review of Morning Trades)

In my morning forecast, I drew attention to the 1.1257 level and planned to base entry decisions around it. Let's look at the 5-minute chart and analyze what happened there

Miroslaw Bawulski 19:01 2025-05-09 UTC+2

What to Pay Attention to on May 9? A Breakdown of Fundamental Events for Beginners

There are no macroeconomic events scheduled for Friday. Fundamental developments will also be limited, but it's entirely unclear which factors influence price formation. The pound and the euro had reasons

Paolo Greco 06:19 2025-05-09 UTC+2

How to Trade the GBP/USD Pair on May 9? Simple Tips and Trade Analysis for Beginners

Analysis of Thursday's Trades 1H Chart of GBP/USD On Thursday, the GBP/USD pair continued its choppy decline within the sideways channel and failed to break out, unlike the EUR/USD pair

Paolo Greco 05:55 2025-05-09 UTC+2

How to Trade the EUR/USD Pair on May 9? Simple Tips and Trade Analysis for Beginners

Analysis of Thursday's Trades 1H Chart of EUR/USD On Thursday, the EUR/USD currency pair unexpectedly exited the sideways channel where it had been trading for three weeks. This occurred during

Paolo Greco 05:55 2025-05-09 UTC+2

Trading Recommendations and Analysis for GBP/USD on May 9: The Pound Remains Unshaken

On Thursday, the GBP/USD currency pair continued trading within the sideways channel, visible in the hourly timeframe. Two central bank meetings — each of which could be considered favorable

Paolo Greco 04:05 2025-05-09 UTC+2

Trading Recommendations and Analysis for EUR/USD on May 9: Everything Eventually Comes to an End

The EUR/USD currency pair exhibited a particularly interesting trend on Thursday. As a reminder, the FOMC meeting results were announced Wednesday evening, and we once again considered them hawkish. It's

Paolo Greco 04:05 2025-05-09 UTC+2

GBP/USD: Trading Plan for the U.S. Session on May 8th (Review of Morning Trades)

In my morning forecast, I focused on the 1.3286 level and planned to base market entries from it. Let's look at the 5-minute chart and analyze what happened. A breakout

Miroslaw Bawulski 19:22 2025-05-08 UTC+2

EUR/USD: Trading Plan for the U.S. Session on May 8th (Review of Morning Trades)

In my morning forecast, I focused on the 1.1269 level and planned to make market entry decisions from it. Let's take a look at the 5-minute chart and analyze what

Miroslaw Bawulski 19:19 2025-05-08 UTC+2

How to Trade the GBP/USD Pair on May 8? Simple Tips and Trade Analysis for Beginners

Analysis of Wednesday's Trades 1H Chart of GBP/USD The GBP/USD pair showed no notable movements on Wednesday. After Jerome Powell stated the need for more time to assess the full

Paolo Greco 06:05 2025-05-08 UTC+2
Can't speak right now?
Ask your question in the chat.
Widget callback
 

Dear visitor,

Your IP address shows that you are currently located in the USA. If you are a resident of the United States, you are prohibited from using the services of InstaFintech Group including online trading, online transfers, deposit/withdrawal of funds, etc.

If you think you are seeing this message by mistake and your location is not the US, kindly proceed to the website. Otherwise, you must leave the website in order to comply with government restrictions.

Why does your IP address show your location as the USA?

  • - you are using a VPN provided by a hosting company based in the United States;
  • - your IP does not have proper WHOIS records;
  • - an error occurred in the WHOIS geolocation database.

Please confirm whether you are a US resident or not by clicking the relevant button below. If you choose the wrong option, being a US resident, you will not be able to open an account with InstaForex anyway.

We are sorry for any inconvenience caused by this message.