To open long positions on EURUSD, you need:
In my morning forecast, I paid attention to the 1.1317 level and advised making decisions on entering the market. Let's look at the 5-minute chart and figure out what happened. The released fundamental data on inflation in the eurozone returned demand for the euro, which led to an increase in the resistance area of 1.1317, from where I advised opening short positions. As a result of the formation of a false breakdown, a sell signal was formed, which is valid at the time of writing the article. The pair went down about 13 points, and it seems that traders decided not to force events and wait for data on the American labor market. The technical picture for the second half of the day has not changed in any way. And what were the entry points for the pound this morning?
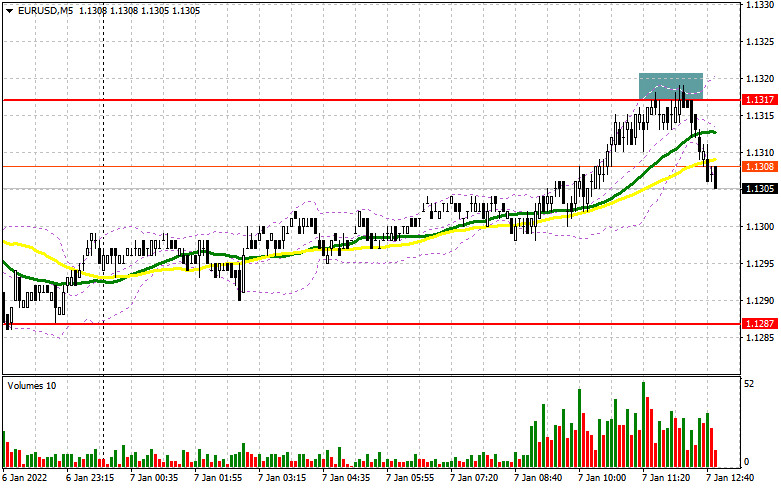
It will be very important how during the American session traders will react to the report on the unemployment rate in the United States and the change in the number of people employed in the non-agricultural sector. Fairly steady growth of new jobs is predicted, which may lead to a strengthening of the dollar. For this reason, buyers need to focus their attention on the 1.1287 level, to which the pair can quickly collapse after the data. Only the formation of a false breakdown there, by analogy with yesterday, will lead to the formation of a signal to buy the euro in the expectation of a repeated recovery to the resistance of 1.1317, which could not be fixed above today again. An important task will be the breakdown of this range, and the reverse test from top to bottom will open up the possibility of a jump to the area of levels: 1.1344 and 1.1375, where I recommend fixing the profits. A more distant target will be the 1.1415 area, but such a scenario is possible only in the case of weak fundamental statistics for the United States. With the pair declining during the American session and the lack of bull activity at 1.1287, it is best to postpone purchases to larger support of 1.1265. However, I advise you to open long positions there when forming a false breakdown. From the 1.1248 level, you can buy EUR/USD immediately for a rebound with the aim of an upward correction of 20-25 points within a day.
To open short positions on EURUSD, you need:
Today, sellers have again done everything possible to keep the market under their control. While trading will be conducted below 1.1317, we can expect a larger drop in the pair in the short term. If EUR/USD rises again today during the US session, sellers need to try to protect this level in order not to miss the pair above 1.1317 again – this will lead to a change in direction of movement. Only the formation of a false breakdown at 1.1317 forms the first entry point into short positions in the expectation of a return of pressure on EUR/USD and a repeated decline to the area of 1.1287. A more active struggle will unfold for this level. A breakdown and a bottom-up test of this range, together with strong data on the US labor market and an increase in investor confidence in more active actions by the Federal Reserve System to tighten policy – all this will give an additional signal to open short positions with the prospect of a decline to a large minimum of 1.1265. Only going beyond this level will change the market direction to a downward one and demolish several buyers' stop orders, which will cause a larger drop in EUR/USD with the update of the lows: 1.1248 and 1.1224, where I recommend fixing the profits. In the case of the growth of the euro and the lack of activity of bears at 1.1317, it is best not to rush with sales. The optimal scenario will be short positions when forming a false breakdown in the area of 1.1344. You can sell EUR/USD immediately on a rebound from the maximum of 1.1375 or even higher - around 1.1415 with the aim of a downward correction of 15-20 points.
The COT report (Commitment of Traders) for December 28 recorded an increase in both short and long positions, but the latter decreased slightly more, which led to a reduction in the negative value of the delta. These data take into account recent meetings of the Federal Reserve System and the European Central Bank. However, judging by the balance of forces, nothing has changed much, which is generally confirmed by the schedule. Many problems in the economy of the eurozone and the United States remain due to the Omicron coronavirus strain, which does not allow representatives of central banks to live in peace. Most likely, the future monetary policy of the Fed and the ECB will depend on how the situation will develop with the coronavirus after the New Year. The report shows that buyers of risky assets, and we are talking about the euro now, are not in a hurry to build up long positions even after recent statements by the European Central Bank that it plans to fully complete its emergency bond purchase program in March next year. On the other hand, the US dollar also has support: The Federal Reserve system plans to raise interest rates in the spring of next year, which makes the US dollar more attractive. The COT report indicates that long non-commercial positions increased from the level of 189,530 to the level of 196,595, while short non-commercial positions increased from the level of 201,409 to the level of 206,757. This suggests that traders will continue to actively fight for the further direction of the market. At the end of the week, the total non-commercial net position decreased its negative value from -11,879 to -10,162. The weekly closing price, due to the side channel, almost did not change - 1.1277 against 1.1283 a week earlier.
Signals of indicators:
Moving averages
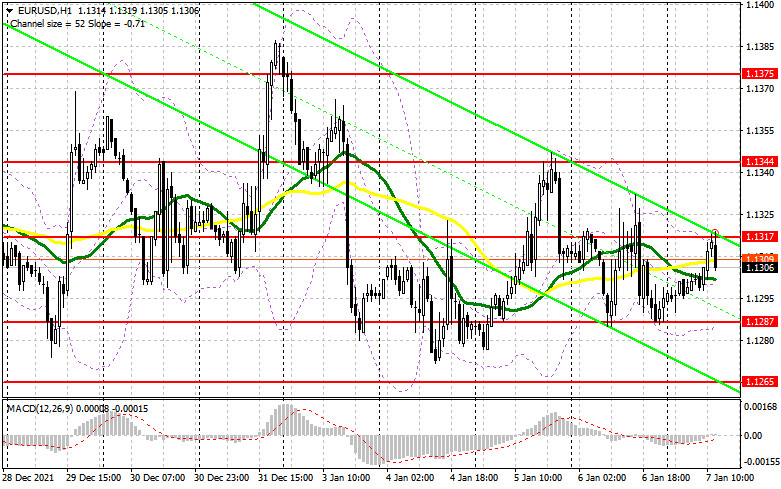
Trading is conducted around 30 and 50 daily moving averages, which indicates market uncertainty.
Note: The period and prices of moving averages are considered by the author on the hourly chart H1 and differ from the general definition of the classic daily moving averages on the daily chart D1.
Bollinger Bands
In the case of growth, the upper limit of the indicator around 1.1317 will act as resistance. In case of a decline, the lower limit of 1.1287 will be used as support.
Description of indicators
- Moving average (moving average determines the current trend by smoothing out volatility and noise). Period 50. The graph is marked in yellow.
- Moving average (moving average determines the current trend by smoothing out volatility and noise). Period 30. The graph is marked in green.
- MACD indicator (Moving Average Convergence / Divergence - moving average convergence/divergence) Fast EMA period 12. Slow EMA period 26. SMA period 9
- Bollinger Bands (Bollinger Bands). Period 20
- Non-profit speculative traders, such as individual traders, hedge funds, and large institutions that use the futures market for speculative purposes and meet certain requirements.
- Long non-commercial positions represent the total long open position of non-commercial traders.
- Short non-commercial positions represent the total short open position of non-commercial traders.
- Total non-commercial net position is the difference between the short and long positions of non-commercial traders.


