empty
09.01.2022 03:42 PM
EUR/USD analysis on January 9. Contradictory Europe does not allow the euro currency to grow.

This image is no longer relevant

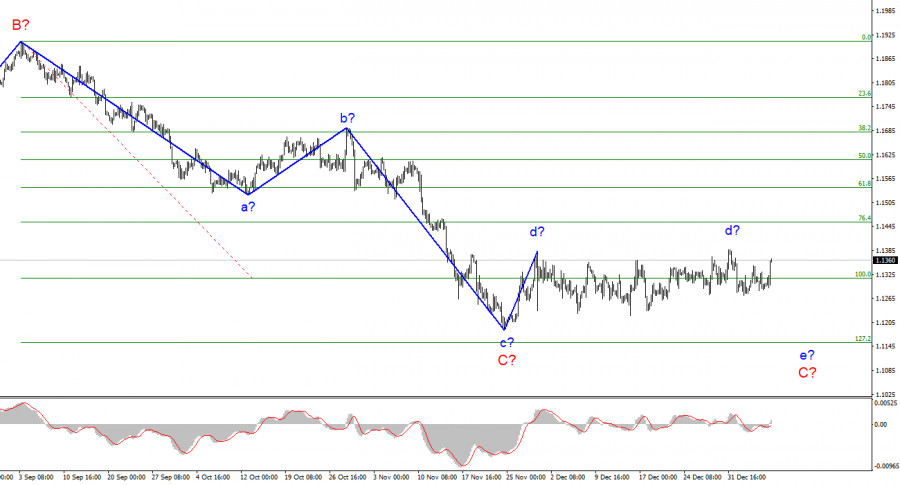
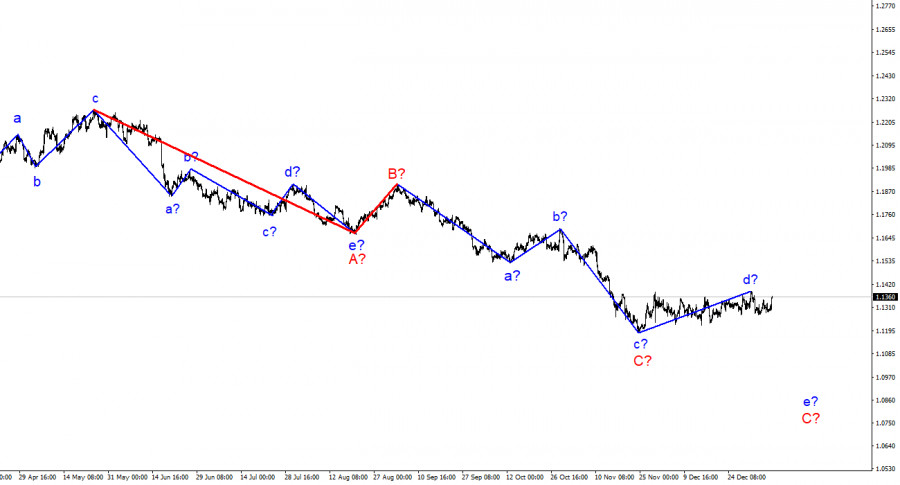
The wave marking of the 4-hour chart for the euro/dollar instrument has not changed for more than a month and after another week nothing new can be added to it. All this time, the horizontal movement continues and at the moment it is not even possible to say for sure whether the construction of the proposed wave d has been completed. The entire wave from November 24 may be both wave d, after which the construction of wave e-C will begin, and the first wave of a new upward (or corrective) trend segment, which has taken on a rather complex form. This is exactly the problem of corrective waves or trend sections. They can become more complicated and take almost any form. Even the breakthrough of the last local peak did not lead to clarity on the issue of the proposed wave d. At the moment, I am inclined to think that the construction of the downward trend section will continue – we have been seeing too uncertain an increase in quotes in recent weeks. However, in any case, the proposed wave d may take on an even more extended and complex form.

Inflation in Europe continues to rise.

The euro/dollar instrument rose by 70 basis points on Friday. Considering how strong the news background was this day, I am surprised that the instrument passed only 70 points and not more than twice. It is the news background that should be carefully considered since both the European Union and the United States have published reports that are important for analyzing the state of economies. Let's start with the Eurozone. The consumer price index rose from 4.9% to 5.0% y/y. It would seem that the increase is quite small, but it is still an increase in prices. It would be more correct to say: the acceleration of price growth. Inflation in the EU remains lower than in the US, where this indicator is already about 7%, but still, 5% is also a lot. The demand for the euro currency, although it did not grow (although it could), still the markets ticked this report in their heads. I also note that the basic consumer price index did not change in December, remaining at 2.6%. On the one hand, such high inflation would have to support the demand for the euro currency. The logic is simple: the higher the inflation, the sooner the ECB will move to measures to limit it. It is unlikely that the central bank will simply observe that prices are rising and do nothing. Since six months ago, the Fed and the ECB have taken a similar position on this issue, preferring to simply wait for inflation to slow down without active actions from the regulator. However, this approach has not yielded positive results. Therefore, the Fed, under market pressure, began to curtail the QE program and is preparing to raise rates. But the current state of the economy, which has already fully recovered after the crisis, allows it to do this. But things are worse in Europe, so an increase in inflation does not guarantee that the ECB will take measures to contain it, since the economy still needs financing and stimulation in order not to lose growth rates.

General conclusions.

Based on the analysis, I conclude that the construction of the descending wave C can be completed. However, the internal wave structure of this wave still allows the construction of another downward, internal wave. Thus, I advise selling the instrument with targets located around the 1.1152 mark until a successful attempt to break the peak of wave d occurs. A restrictive order can be placed above the peak of wave d. You can open one trade, as the MACD turns down quite often.

This image is no longer relevant

Chin Zhao,
Analytical expert of InstaForex
© 2007-2025
Select timeframe
5
min
15
min
30
min
1
hour
4
hours
1
day
1
week
Earn on cryptocurrency rate changes with InstaForex
Download MetaTrader 4 and open your first trade
  • Grand Choice
    Contest by
    InstaForex
    InstaForex always strives to help you
    fulfill your biggest dreams.
    JOIN CONTEST

Recommended Stories

EUR/USD Analysis on May 15, 2025

The wave pattern on the 4-hour chart for EUR/USD has shifted into a bullish formation and remains so. There is little doubt that this transformation has occurred solely

Chin Zhao 19:26 2025-05-15 UTC+2

GBP/USD Analysis on May 15, 2025

The wave markup for GBP/USD has also shifted into a bullish, impulsive structure — "thanks" to Donald Trump. The wave picture is almost identical to that of EUR/USD. Until February

Chin Zhao 19:19 2025-05-15 UTC+2

GBP/USD Analysis on May 14, 2025

The wave structure for GBP/USD has also transformed into a bullish impulsive pattern—"thanks" to Donald Trump. The wave picture is almost identical to that of EUR/USD. Up until February

Chin Zhao 18:01 2025-05-14 UTC+2

EUR/USD Analysis on May 14, 2025

The wave structure on the 4-hour chart for the EUR/USD pair has shifted to a bullish formation and continues to hold that stance. I believe no one doubts that this

Chin Zhao 17:59 2025-05-14 UTC+2

GBP/USD Analysis on May 13, 2025

The wave pattern for GBP/USD has also transformed into a bullish, impulsive structure — "thanks" to Donald Trump. The wave picture is almost identical to that of EUR/USD. Until February

Chin Zhao 18:37 2025-05-13 UTC+2

EUR/USD Analysis on May 13, 2025

The wave structure on the 4-hour chart for EUR/USD has transformed into a bullish pattern and remains such. There is little doubt that this shift was triggered exclusively

Chin Zhao 18:35 2025-05-13 UTC+2

EUR/USD Analysis on May 9, 2025

The wave structure on the 4-hour EUR/USD chart has transformed into a bullish pattern. I believe there's little doubt that this shift was driven solely by the new U.S. trade

Chin Zhao 19:19 2025-05-09 UTC+2

GBP/USD Analysis on May 9, 2025

The wave pattern for the GBP/USD instrument has also shifted into a bullish, impulsive structure—"thanks" to Donald Trump. The wave picture is almost identical to that of EUR/USD. Until February

Chin Zhao 19:16 2025-05-09 UTC+2

GBP/USD Analysis on May 8, 2025

The wave structure for GBP/USD has also transformed into a bullish, impulsive pattern—"thanks" to Donald Trump. The wave picture is nearly identical to that of EUR/USD. Until February

Chin Zhao 19:40 2025-05-08 UTC+2

EUR/USD Analysis on May 8, 2025

The wave pattern on the 4-hour chart for EUR/USD has transformed into a bullish structure. I believe there is little doubt that this transformation was triggered solely

Chin Zhao 19:33 2025-05-08 UTC+2
Can't speak right now?
Ask your question in the chat.
Widget callback
 

Dear visitor,

Your IP address shows that you are currently located in the USA. If you are a resident of the United States, you are prohibited from using the services of InstaFintech Group including online trading, online transfers, deposit/withdrawal of funds, etc.

If you think you are seeing this message by mistake and your location is not the US, kindly proceed to the website. Otherwise, you must leave the website in order to comply with government restrictions.

Why does your IP address show your location as the USA?

  • - you are using a VPN provided by a hosting company based in the United States;
  • - your IP does not have proper WHOIS records;
  • - an error occurred in the WHOIS geolocation database.

Please confirm whether you are a US resident or not by clicking the relevant button below. If you choose the wrong option, being a US resident, you will not be able to open an account with InstaForex anyway.

We are sorry for any inconvenience caused by this message.