empty
12.01.2022 04:28 AM
Forecast and trading signals for EUR/USD for January 12. Detailed analysis of the pair's movement and trade deals. The euro is still not impressive

EUR/USD 5M

This image is no longer relevant

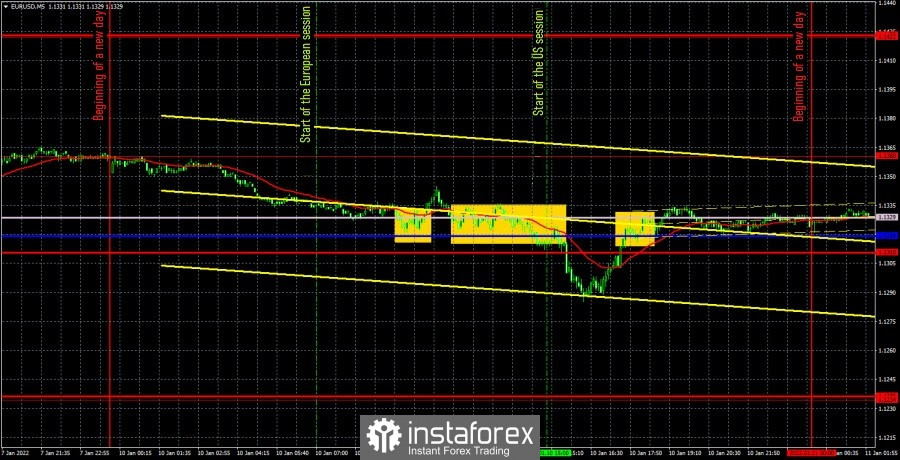
During the second trading day of the week, the EUR/USD pair traded very sluggishly. Despite the fact that the volatility was not the lowest – about 60 points - the movements were as modest as possible. The pair showed a trend movement only in the afternoon. And at the same time, it still remained within the 1.1234-1.1360 horizontal channel. Although in fact this channel has long since narrowed to 90-100 points with an upper limit at 1.1360. The minimum upward slope of the movement is also preserved, but at the same time no benefit can be extracted from this, since the angle of inclination is minimal. That is, in fact, the movement remains sideways. Over the past day, Federal Reserve Chairman Jerome Powell and European Central Bank President Christine Lagarde have given speeches. However, neither the first nor the second gave traders any fundamentally new information. Although the dollar began to fall after Powell's speech, so we can assume that the markets found something negative in his speech. But what can be negative there if the Fed is exclusively hawkish for the first time in a long time? Therefore, it remains only to deal with Tuesday's trading signals. The first buy signal was formed near the Senkou Span B line when the price bounced off it at the end of the European trading session. However, the pair could not continue to grow after this signal and formed another buy signal near the Senkou Span B and Kijun-sen lines, which should be considered collectively as a support area (they were too close to each other). This time, the European currency managed to rise in price by 30 points and even reach the nearest level - the extreme of 1.1360, and even settled below it. It was at this moment that long positions should be closed. The profit was about 17 points. No more deals should have been opened, as the trading day was ending.

We recommend you to familiarize yourself:

Overview of the EUR/USD pair. January 12. Jerome Powell promises to fight inflation.

Overview of the GBP/USD pair. January 12. The British economy will face new challenges due to the "safe Omicron".

Forecast and trading signals for GBP/USD for January 12. Detailed analysis of the movement of the pair and trade deals.

EUR/USD 1H

This image is no longer relevant

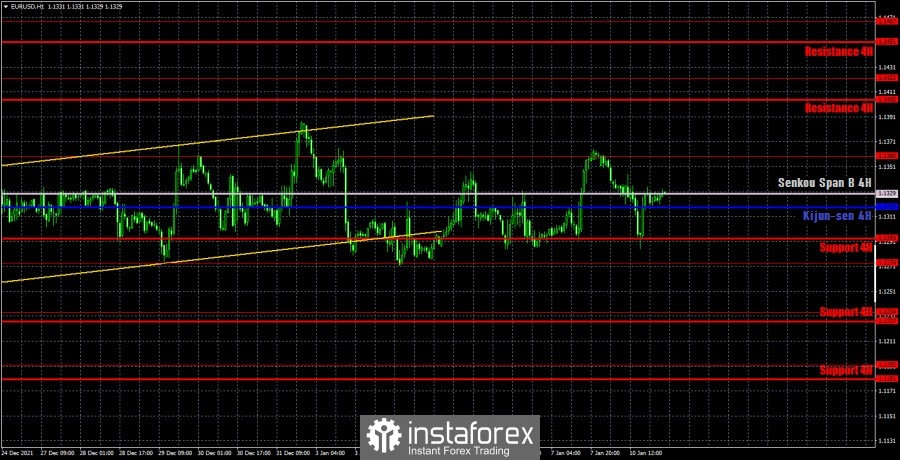
The technical picture on the hourly timeframe has not changed for a long time. In principle, the current nature of the movement is such that it is possible to build new horizontal channels almost every day. One was formed today, but it is available just to illustrate what is happening. The movement, no matter from which side you look, is still horizontal. On Wednesday, we allocate the following levels for trading - 1.1234, 1.1274, 1.1360, 1.1422, as well as the Senkou Span B (1.1329) and Kijun-sen (1.1323) lines. The lines of the Ichimoku indicator may change their position during the day, which should be taken into account when searching for trading signals. Signals can be "bounces" and "breakthroughs" of these levels and lines. Do not forget about placing a Stop Loss order at breakeven if the price went in the right direction of 15 points. This will protect against possible losses if the signal turns out to be false. It should also be taken into account the fact that the flat is being maintained now, so the lines of the Ichimoku indicator are weak. On January 12, the key event of the day is the publication of the US inflation report. We believe that it is this report that can provoke a reaction from traders, which will depend on whether this indicator continues to accelerate. A report on industrial production in the European Union will also be published, but it is secondary.

Explanations for the chart:

Support and Resistance Levels are the levels that serve as targets when buying or selling the pair. You can place Take Profit near these levels.

Kijun-sen and Senkou Span B lines are lines of the Ichimoku indicator transferred to the hourly timeframe from the 4-hour one.

Support and resistance areas are areas from which the price has repeatedly rebounded off.

Yellow lines are trend lines, trend channels and any other technical patterns.

Indicator 1 on the COT charts is the size of the net position of each category of traders.

Indicator 2 on the COT charts is the size of the net position for the non-commercial group.

Paolo Greco,
Analytical expert of InstaForex
© 2007-2025
Select timeframe
5
min
15
min
30
min
1
hour
4
hours
1
day
1
week
Earn on cryptocurrency rate changes with InstaForex
Download MetaTrader 4 and open your first trade
  • Grand Choice
    Contest by
    InstaForex
    InstaForex always strives to help you
    fulfill your biggest dreams.
    JOIN CONTEST

Recommended Stories

How to Trade the GBP/USD Pair on April 24? Simple Tips and Trade Analysis for Beginners

Analysis of Wednesday's Trades 1H Chart of GBP/USD On Wednesday, the GBP/USD pair closely followed the movements of the EUR/USD pair, further confirming that the current situation hinges

Paolo Greco 05:50 2025-04-24 UTC+2

How to Trade the EUR/USD Pair on April 24? Simple Tips and Trade Analysis for Beginners

Analysis of Wednesday's Trades 1H Chart of EUR/USD On Wednesday, the EUR/USD currency pair traded in a mixed manner. During the day, the price changed direction several times, and macroeconomic

Paolo Greco 05:50 2025-04-24 UTC+2

Trading Recommendations and Analysis for GBP/USD on April 24: De-escalation or False Alarm?

On Wednesday, the GBP/USD currency pair followed the same trend as the EUR/USD pair. The British pound also plummeted sharply overnight following two statements from Donald Trump, then quickly recovered

Paolo Greco 03:16 2025-04-24 UTC+2

Trading Recommendations and Analysis for EUR/USD on April 24: Chaos in the Market Persists

The EUR/USD currency pair traded in both directions throughout Wednesday, constantly changing its trajectory. The trading day began with a price collapse following Donald Trump's announcement that he would

Paolo Greco 03:16 2025-04-24 UTC+2

GBP/USD: Trading Plan for the US Session on April 23rd (Review of Morning Trades)

In my morning forecast, I drew attention to the 1.3304 level and planned to make market entry decisions from it. Let's look at the 5-minute chart and analyze what happened

Miroslaw Bawulski 18:23 2025-04-23 UTC+2

EUR/USD: Trading Plan for the US Session on April 23rd (Review of Morning Trades)

In my morning forecast, I highlighted the 1.1412 level and planned to make trading decisions from there. Let's take a look at the 5-minute chart and analyze what happened

Miroslaw Bawulski 18:20 2025-04-23 UTC+2

How to Trade the GBP/USD Pair on April 23? Simple Tips and Trade Analysis for Beginners

Analysis of Tuesday's Trades 1H Chart of GBP/USD The GBP/USD pair declined rather significantly on Tuesday. While the pound's drop began somewhat sluggishly, in the evening, Donald Trump finally decided

Paolo Greco 06:45 2025-04-23 UTC+2

How to Trade the EUR/USD Pair on April 23? Simple Tips and Trade Analysis for Beginners

Analysis of Tuesday's Trades 1H Chart of EUR/USD The EUR/USD currency pair showed a relatively substantial decline on Tuesday. Euro quotes fell almost throughout the day, with the move intensifying

Paolo Greco 06:45 2025-04-23 UTC+2

Trading Recommendations and Analysis for GBP/USD on April 23: Has the Market Remembered Where the "Sell" Button Is?

On Tuesday, the GBP/USD currency pair showed very low volatility and a general lack of interest in trading. While the euro traded with a noticeable decline, the British pound mostly

Paolo Greco 04:29 2025-04-23 UTC+2

Trading Recommendations and Analysis for EUR/USD on April 23: Rollercoaster or Correction?

The EUR/USD currency pair traded lower on Tuesday. Once again, volatility was far from low, which might suggest the presence of significant events or news during the day. However, there

Paolo Greco 04:29 2025-04-23 UTC+2
Can't speak right now?
Ask your question in the chat.
Widget callback
 

Dear visitor,

Your IP address shows that you are currently located in the USA. If you are a resident of the United States, you are prohibited from using the services of InstaFintech Group including online trading, online transfers, deposit/withdrawal of funds, etc.

If you think you are seeing this message by mistake and your location is not the US, kindly proceed to the website. Otherwise, you must leave the website in order to comply with government restrictions.

Why does your IP address show your location as the USA?

  • - you are using a VPN provided by a hosting company based in the United States;
  • - your IP does not have proper WHOIS records;
  • - an error occurred in the WHOIS geolocation database.

Please confirm whether you are a US resident or not by clicking the relevant button below. If you choose the wrong option, being a US resident, you will not be able to open an account with InstaForex anyway.

We are sorry for any inconvenience caused by this message.