empty
28.01.2022 09:14 PM
Wave analysis of EUR/USD on January 28: dollar hitting 18-month high ahead of weekend

This image is no longer relevant

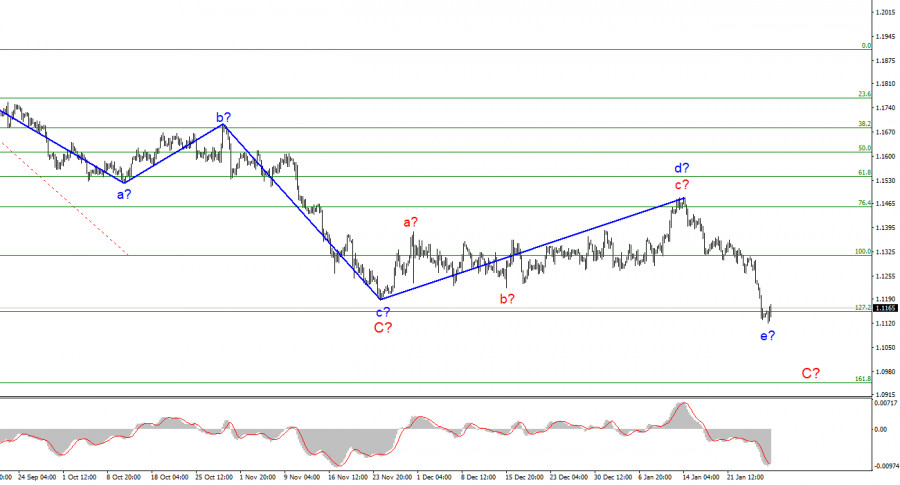
The wave picture in the 4-hour EUR/USD chart still looks rather convincing. The d wave turned out to be longer than expected. Still, it does not change the meaning of the wave structure. Last week's decline in the pair resulted in a break of the low of the c wave within C. Therefore, the current downward wave is undoubtedly the e wave within C just as I thought. As a result, the C wave consists of five sub-waves. The e wave, in turn, may also become much longer and consist of five smaller waves. A successful break of 1.1152 (127.2% Fibo) will indicate bears' readiness to continue selling EUR/USD. Still, traders decided to take a break ahead of the weekend. Today's news feed lacked any significant reports, and market participants seemed to be tired of the busy week.

Will the USD bullish trend continue?

On Friday, EUR/USD barely added 25 pips. The intraday range was also about 25 pips. So, the market was less active than yesterday or the day before yesterday. However, it is not surprising as a bunch of important reports saw the light in the United States on Wednesday and Thursday. Amid that, a new downward wave appeared which may become longer. Moreover, the general trend that started on May 25, 2021 may turn into the 5-wave structure. Currently, it is of the A-B-C type but it has every chance of becoming the A-B-C-D-E one. It may happen if the fundamental factors continue to be favorable for the US dollar. There is every indication that the year 2022 will be a rather good one for the American currency. The Federal Reserve can afford to take the most hawkish stance in comparison with other central banks, in particular, the ECB and the Bank of England. The European financial regulator has no intentions of hiking the rate this year. The most decisive action it can take is to withdraw from the emergent PEPP stimulus program and the basic APP program. In addition, the current economic indicators are rather disappointing. The EU consumer confidence index came in at -8.5 points. It is a minor report, but it clearly reflects the current state of things. Things are not going smoothly in the United States either, but inflation will continue to put pressure on the Fed until it starts to decline to 2%. And the Fed will have no other choice but to use all available tools to restrain inflation and prevent it from increasing further. These factors may last for most of this year and they are positive for the US dollar. The current wave picture indicates a further decline of the instrument. So these expectations may turn out to be valid.

General conclusion

I can conclude that the d wave has been completed. Therefore, it is reasonable to sell EUR/USD in case of the wave e within C forms with the target at 1.0948 (161.8% Fibo). If the level of 1.1152 fails to be broken, it may result in the completion of an upward corrective wave e within C.

This image is no longer relevant

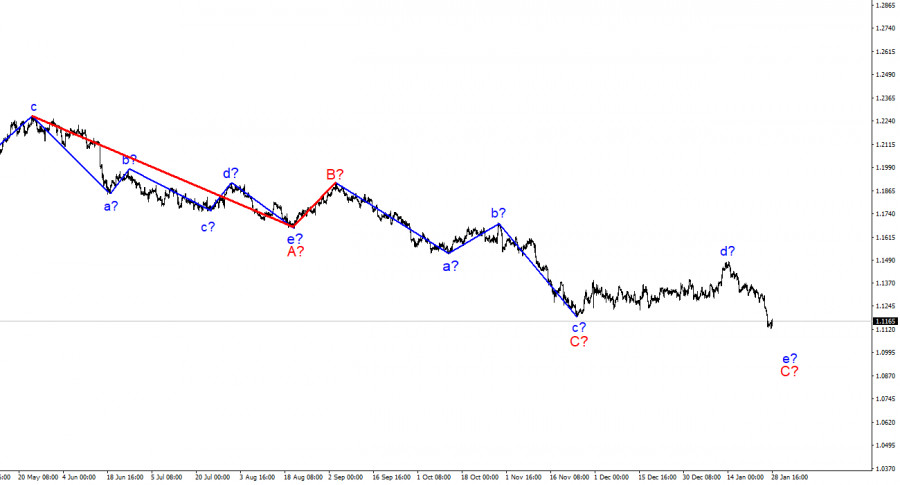
As seen on a larger scale, the construction of the alleged wave e within C is now continuing. This wave may turn out to consist of five smaller waves, or it may become shorter. Bearing in mind that all previous waves were not too long and were of the same size, the current wave is likely to be the same. I expect this wave to get completed in the near future.

Chin Zhao,
Analytical expert of InstaForex
© 2007-2025
Select timeframe
5
min
15
min
30
min
1
hour
4
hours
1
day
1
week
Earn on cryptocurrency rate changes with InstaForex
Download MetaTrader 4 and open your first trade
  • Grand Choice
    Contest by
    InstaForex
    InstaForex always strives to help you
    fulfill your biggest dreams.
    JOIN CONTEST

Recommended Stories

GBP/USD Analysis on May 14, 2025

The wave structure for GBP/USD has also transformed into a bullish impulsive pattern—"thanks" to Donald Trump. The wave picture is almost identical to that of EUR/USD. Up until February

Chin Zhao 18:01 2025-05-14 UTC+2

EUR/USD Analysis on May 14, 2025

The wave structure on the 4-hour chart for the EUR/USD pair has shifted to a bullish formation and continues to hold that stance. I believe no one doubts that this

Chin Zhao 17:59 2025-05-14 UTC+2

GBP/USD Analysis on May 13, 2025

The wave pattern for GBP/USD has also transformed into a bullish, impulsive structure — "thanks" to Donald Trump. The wave picture is almost identical to that of EUR/USD. Until February

Chin Zhao 18:37 2025-05-13 UTC+2

EUR/USD Analysis on May 13, 2025

The wave structure on the 4-hour chart for EUR/USD has transformed into a bullish pattern and remains such. There is little doubt that this shift was triggered exclusively

Chin Zhao 18:35 2025-05-13 UTC+2

EUR/USD Analysis on May 9, 2025

The wave structure on the 4-hour EUR/USD chart has transformed into a bullish pattern. I believe there's little doubt that this shift was driven solely by the new U.S. trade

Chin Zhao 19:19 2025-05-09 UTC+2

GBP/USD Analysis on May 9, 2025

The wave pattern for the GBP/USD instrument has also shifted into a bullish, impulsive structure—"thanks" to Donald Trump. The wave picture is almost identical to that of EUR/USD. Until February

Chin Zhao 19:16 2025-05-09 UTC+2

GBP/USD Analysis on May 8, 2025

The wave structure for GBP/USD has also transformed into a bullish, impulsive pattern—"thanks" to Donald Trump. The wave picture is nearly identical to that of EUR/USD. Until February

Chin Zhao 19:40 2025-05-08 UTC+2

EUR/USD Analysis on May 8, 2025

The wave pattern on the 4-hour chart for EUR/USD has transformed into a bullish structure. I believe there is little doubt that this transformation was triggered solely

Chin Zhao 19:33 2025-05-08 UTC+2

GBP/USD Analysis on May 7, 2025

The wave pattern for GBP/USD has also transformed into a bullish, impulsive structure—"thanks" to Donald Trump. The wave picture closely resembles that of EUR/USD. Until February 28, we observed

Chin Zhao 19:55 2025-05-07 UTC+2

EUR/USD Analysis on May 7, 2025

The wave pattern on the 4-hour chart for EUR/USD has transformed into a bullish structure. I believe there's little doubt that this transformation has occurred solely

Chin Zhao 19:51 2025-05-07 UTC+2
Can't speak right now?
Ask your question in the chat.
Widget callback
 

Dear visitor,

Your IP address shows that you are currently located in the USA. If you are a resident of the United States, you are prohibited from using the services of InstaFintech Group including online trading, online transfers, deposit/withdrawal of funds, etc.

If you think you are seeing this message by mistake and your location is not the US, kindly proceed to the website. Otherwise, you must leave the website in order to comply with government restrictions.

Why does your IP address show your location as the USA?

  • - you are using a VPN provided by a hosting company based in the United States;
  • - your IP does not have proper WHOIS records;
  • - an error occurred in the WHOIS geolocation database.

Please confirm whether you are a US resident or not by clicking the relevant button below. If you choose the wrong option, being a US resident, you will not be able to open an account with InstaForex anyway.

We are sorry for any inconvenience caused by this message.