EUR/USD 5M
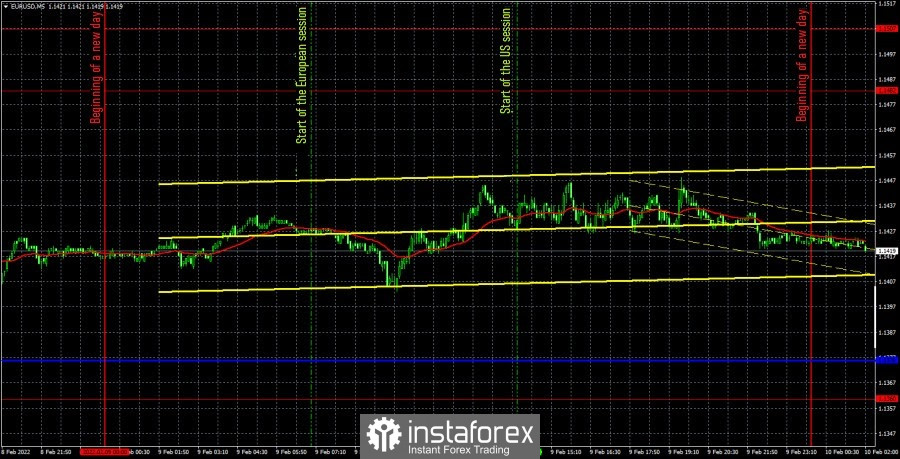
The EUR/USD pair was trading in an outright flat on Wednesday. You don't even need to be an expert to notice it. A minimal upward trend was observed during the day, but it was purely formal. As a result, the pair issued an "extreme" volatility equal to 43 points and during the day it never worked out a single line of the Ichimoku indicator, nor an extreme level. Accordingly, not a single trading signal was formed during the day. Consequently, there was not a single open transaction either. It's practically a day off.
Separately, you can put in a good word for the fundamental and macroeconomic background. However, there is also absolutely nothing to note here. No important report or other event concerning the euro or the dollar on Wednesday. Thus, no matter how trite it may sound, it remains only to wait for these events to appear. It should also be noted that the market has now fallen into hibernation. And it may take quite a long time to get it out of there. Recall that at the end of 2021, the pair was in a blatant flat for several months and no fundamental events could bring it out of this state.
COT report

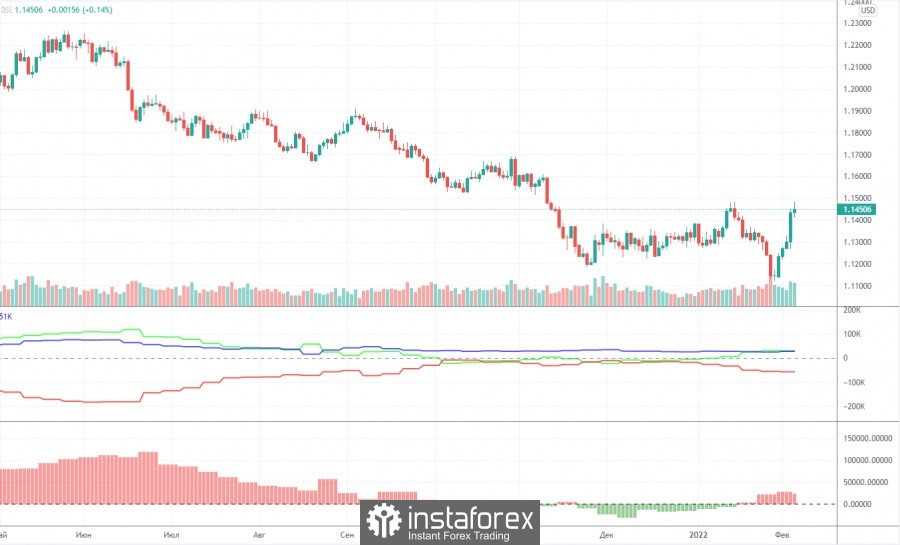
The new Commitment of Traders (COT) report, which was released on Friday, showed an increase in bullish sentiment among a group of professional traders ("non-commercial"). As you can see in the chart above, the green line indicating the "non-commercial" net position continues to be above zero, although in fact it has slightly decreased following the results of the last COT report. However, there is nothing to be surprised about, since Thursday, when the European Central Bank summed up the results of the meeting, and traders were being active, did not get into the latest report. Thus, even without data on Wednesday, Thursday and Friday, we see that the major players are slowly starting to buy the euro currency, and do not continue to sell it. The red and green lines of the first indicator were near the zero level for a long time, which signaled the end of the last trend. And the past trend is the downward trend of 2021. Given that market participants completely ignored the fundamental background of last week, we conclude that the time for long positions on the dollar and short positions on the euro has come to an end. The "sharp start" of the euro also speaks in favor of the beginning of a new upward trend. The EU currency has grown almost out of the blue by 300 points in five days. This is how most trends begin. Of course, nothing prevents traders from winning back this injustice in the new week. Still, the pair should be adjusted from time to time, even if the fundamental background does not speak in favor of this. But for now, we consider this scenario to be an alternative scenario.
We recommend to familiarize yourself with:
Overview of the EUR/USD pair. February 10. Markets are starting to believe that the ECB will raise rates this year.
Overview of the GBP/USD pair. February 10. Northern Ireland Protocol: Johnson started talking about Article 16 again.
Forecast and trading signals for GBP/USD on February 10. Detailed analysis of the movement of the pair and trading transactions.
EUR/USD 1H

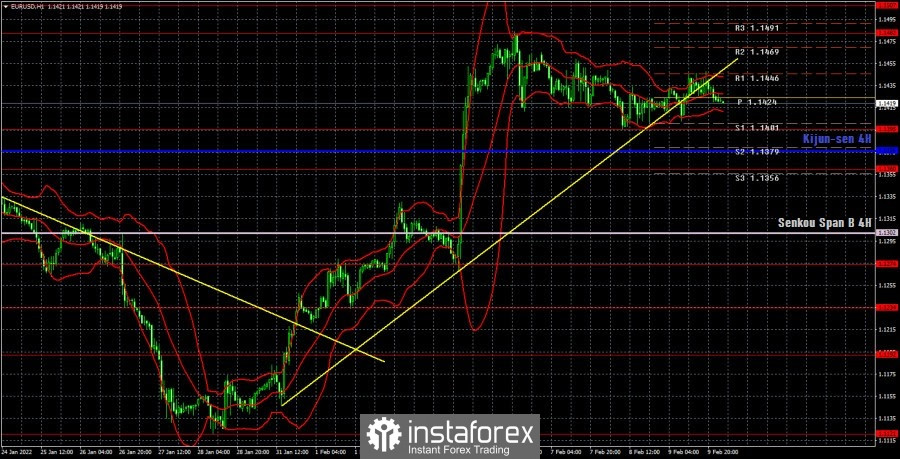
On the hourly timeframe, the euro/dollar pair worked out the trend line on Wednesday... nothing. There was no rebound from this line, no clear breakthrough. A typical flat, when important lines and levels are simply ignored. Thus, at the moment it is not even possible to say with certainty whether the upward trend continues? Volatility may increase today, as the US inflation report is an important report. But it can turn out to be as neutral as possible in its meaning and not provoke any movements. We allocate the following levels for trading on Thursday – 1.1274, 1.1360, 1.1395, 1.1482, 1.1507, 1.1534, as well as the Senkou Span B (1.1302) and Kijun-sen (1.1376) lines. There are also support and resistance levels, but no signals will be formed near them. The lines of the Ichimoku indicator may change their position during the day, which should be taken into account when searching for trading signals. Signals can be "bounces" and "breakthrough" levels - extremes and lines. Do not forget about placing a Stop Loss order at breakeven if the price went in the right direction of 15 points. This will protect you against possible losses if the signal turns out to be false. No important events or publications planned in the European Union again on February 10. Well, at least in the United States, just one, but the inflation report is important. We expect that volatility will still increase today, but the pair can move in any direction. This should be taken into account, since at this time the increase in inflation in America no longer means an increase in the probability of a Federal Reserve rate hike. In any case, it will increase in 2022.
Explanations for the chart:
Support and Resistance Levels are the levels that serve as targets when buying or selling the pair. You can place Take Profit near these levels.
Kijun-sen and Senkou Span B lines are lines of the Ichimoku indicator transferred to the hourly timeframe from the 4-hour one.
Support and resistance areas are areas from which the price has repeatedly rebounded off.
Yellow lines are trend lines, trend channels and any other technical patterns.
Indicator 1 on the COT charts is the size of the net position of each category of traders.
Indicator 2 on the COT charts is the size of the net position for the non-commercial group.


