To open long positions on EURUSD, you need:
In my morning forecast, I paid attention to the level of 1.1080 and recommended making decisions on entering the market. Let's look at the 5-minute chart and figure out what happened. There were no fundamental statistics in the first half of the day, so the focus shifted to the meeting of the European Central Bank, the results of which will be known this afternoon. Despite a serious surge in volatility during the European session, it was not possible to achieve a normal false breakdown from the level of 1.1080. For this reason, I have not seen any deals on the pair. For the second half of the day, the technical picture has not changed in any way. And what were the entry points for the pound this morning?
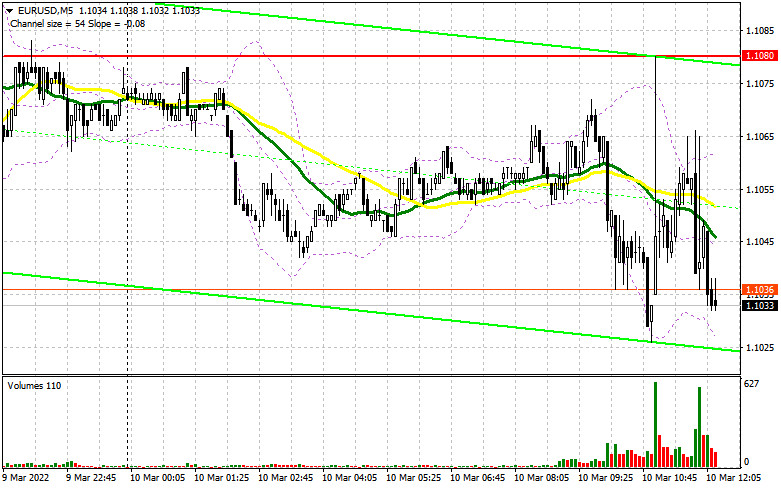
As I said this morning, traders will focus all their attention on the meeting of the European Central Bank. And let no one expect changes in monetary policy, much less an increase in interest rates, but the ECB's decision today will be greatly influenced by the latest inflation data in the eurozone. And we are talking not only about the general inflation indicator but also about the basic one. Do not be surprised if the president of the European Central Bank, Christine Lagarde, makes several rather harsh statements, which will lead to the continuation of the euro's growth. In the afternoon, we are also waiting for very important data on inflation in the US, which may lead to another major surge in volatility. An important task of the bulls for the American session remains to protect the support of 1.1017, which is where the euro is heading now. The decline of the euro and the formation of a false breakdown there after Christine Lagarde's press conference and the release of data on the consumer price index in the United States - all this will lead to a buy signal. It is possible to count on a larger recovery of EUR/USD only after the smoothing of geopolitical tensions following the meeting of representatives of Russia and Ukraine, which is currently taking place in Turkey, as well as after the breakthrough of the 1.1080 level, above which it was not possible to get out in the first half of the day. A breakdown of this range will cross out the bearish trend and clamp the pair in a wide side channel. The reverse test of 1.1080 from top to bottom during the release of US data will give a buy signal and open up the possibility of recovery to the area of 1.1139. A more distant target will be the 1.1164 area, where I recommend fixing the profits. In the event of an aggravation of the geopolitical situation and the soft rhetoric of the president of the European Central Bank, pressure on the euro will quickly return. With a decline and lack of activity at 1.1017, and there are moving averages, traders will begin to close long positions, which will only increase the pressure on the pair. Therefore, it is best to postpone purchases until a false breakdown in the support area of 1.0947. You can buy immediately for a rebound from the minimum of 1.0879, or even lower - around 1.0810 with the aim of an upward correction of 20-25 points within the day.
To open short positions on EURUSD, you need:
Although the bears showed themselves in the area of 1.1080, so far there are no active actions to compensate for yesterday's fall. The return of demand for the dollar may occur if Christine Lagarde takes a soft stance on monetary policy at today's press conference after the meeting of the European Central Bank. In the meantime, sellers need to continue to think about how to protect the resistance of 1.1080, since by releasing a pair above this range, demand for the euro will return. The formation of a false breakdown after the ECB meeting will lead to a sell signal and the opening of new short positions to reduce the euro to the first important support of 1.1017. A breakdown of this area and a reverse test from the bottom up can take place very quickly, which will give an additional signal to open short positions already with the prospect of falling to the lows: 1.0947 and 1.0879. The downward movement will be fast, as a large number of buyers' stop orders are concentrated at these levels. The farthest target will be the 1.0810 area, where I recommend fixing the profits. However, such a large sell-off is possible only with very strong US inflation, which will simply force the Federal Reserve System to act more aggressively this month. In the case of the growth of the euro and the absence of bears at 1.1080, it is best not to rush with sales. It is possible that, as yesterday, the bulls will begin to act more aggressively in the event of changes in the rhetoric of the president of the European Central Bank, and a breakthrough of this level will pull the sellers' stop orders. Therefore, the optimal scenario will be short positions when forming a false breakdown in the area of 1.1139. You can sell EUR/USD immediately on a rebound from 1.1184, or even higher - around 1.1229 with the aim of a downward correction of 15-20 points.
The COT report (Commitment of Traders) for March 1 recorded an increase in both long and short positions. The first ones turned out to be more, which led to an increase in the positive delta. In the context of the ongoing tough geopolitical conflict that has affected almost the whole world, it makes no sense to talk about what position investors held a week ago since everything is changing at lightning speed. The data yesterday no longer have any significance today, since no one knows how the sanctions imposed by the United States and EU countries will affect the Russian economy, as well as what the conflict between Russia and Ukraine will eventually lead to. The main question is how long it will all last. Against this background, it does not matter much what the policy of the European Central Bank or the Federal Reserve System will be since, in the event of an aggravation of the military conflict, the markets will fly down again. Now Russia and Ukraine have sat down at the negotiating table, and much will depend on the results of these meetings - there will be a lot of them. This week, the European Central Bank will also hold a meeting and important February data on US inflation will be released, which will lead to a surge in volatility but is unlikely to correct the situation in favor of buyers of risky assets. I recommend continuing to buy a dollar. I advise you to be quite careful about risky assets and buy euros only as the tense relations between Russia, Ukraine, the EU, and the USA weaken. Any new sanctions actions against the Russian Federation will have serious economic consequences, which will affect the financial markets, as well as affect not only the Russian ruble but also the European currency. The COT report indicates that long non-commercial positions increased from the level of 214,195 to the level of 228,385, while short non-commercial positions increased from the level of 154,163 to the level of 163,446. At the end of the week, the total non-commercial net position increased to 64,939 against 59,306. The weekly closing price dropped from 1.1309 to 1.1214.
Signals of indicators:
Moving averages
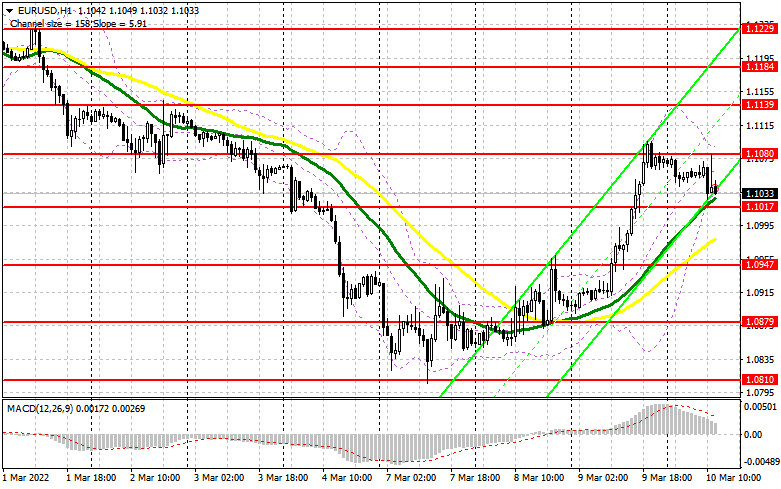
Trading is conducted slightly above 30 and 50 daily moving averages, which indicates the continuation of the upward correction of the pair.
Note: The period and prices of moving averages are considered by the author on the hourly chart H1 and differ from the general definition of the classic daily moving averages on the daily chart D1.
Bollinger Bands
A breakthrough of the lower limit of the indicator in the area of 1.1017 will increase pressure on the euro. A breakthrough of the upper limit of the indicator in the area of 1.1080 will lead to a new wave of growth of the pair.
Description of indicators
- Moving average (moving average determines the current trend by smoothing out volatility and noise). Period 50. The graph is marked in yellow.
- Moving average (moving average determines the current trend by smoothing out volatility and noise). Period 30. The graph is marked in green.
- MACD indicator (Moving Average Convergence / Divergence - moving average convergence/divergence) Fast EMA period 12. Slow EMA period 26. SMA period 9
- Bollinger Bands (Bollinger Bands). Period 20
- Non-profit speculative traders, such as individual traders, hedge funds, and large institutions that use the futures market for speculative purposes and meet certain requirements.
- Long non-commercial positions represent the total long open position of non-commercial traders.
- Short non-commercial positions represent the total short open position of non-commercial traders.
- Total non-commercial net position is the difference between the short and long positions of non-commercial traders.


