To open long positions on GBP/USD, you need:
In my morning forecast, I paid attention to the level of 1.3194 and recommended making decisions on entering the market. Let's look at the 5-minute chart and figure out what happened. An unsuccessful attempt by the bulls to gain a foothold above the resistance of 1.3194 led to the formation of a sell signal for the pound, after which the pair went down more than 50 points. We did not reach the nearest support of 1.3138, so from a technical point of view, nothing has changed for the second half of the day. And what were the entry points for the euro this morning?
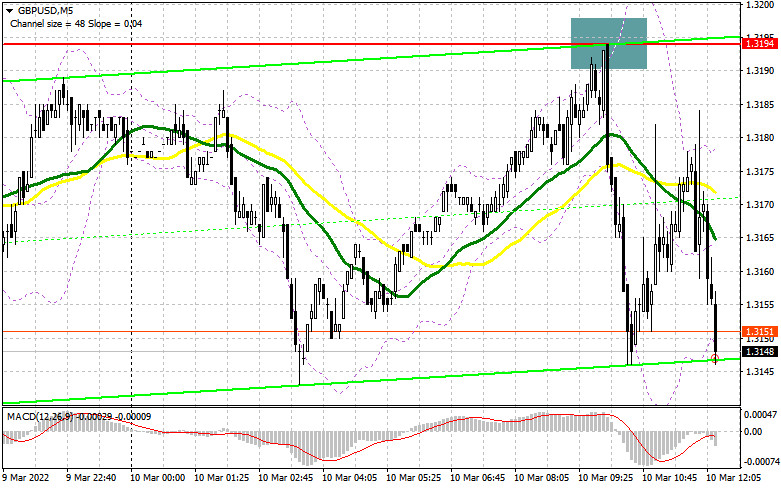
During the American session, everything will depend on today's data on inflation in the United States, which many are now focusing on. The fall of the pound may be limited since we have clear aggressive actions of the Bank of England to interest rates ahead since inflation in the UK is almost the most important headache of citizens and politicians governing the country. An increase in rates will lead to a return of demand for the pound. An unsuccessful attempt by bulls to get above 1.3194 can become a very serious problem, as self-doubt can bring new sellers back to the market - especially if the US inflation data is higher than economists' forecasts. An important task of the bulls during the American session remains to protect the support of 1.3138, where the moving averages are playing on their side. Long positions from this level can be considered only after the formation of a false breakdown since the entry will be carried out against the bear market. Growth in this scenario will bring the pair back to the resistance of 1.3194, which it was not possible to get above today. Only a breakthrough and a reverse test of this area from top to bottom, together with declining inflation in the United States, will lead to the demolition of several sellers' stop orders, allowing them to continue to increase long positions more actively. The target in this case will be the 1.3244 area. A more difficult task will be to reach the resistance of 1.3275 - this will deal a strong blow to the bearish trend observed since the end of February. I recommend fixing profits there. In the scenario of a decline in GBP/USD in the afternoon and the absence of bulls at 1.3138, it is best to postpone purchases until the next support around 1.3085 - this is a more reliable level. But I advise you to open long positions there only when a false breakdown is formed. You can buy GBP/USD immediately on a rebound from 1.3034, or even lower - from a minimum of 1.2976, counting on a correction of 20-25 points within a day.
To open short positions on GBP/USD, you need:
Bears have defended the level of 1.3194, but they are not in a hurry to return to the market before the key statistics in the United States, which can predetermine the further actions of the Federal Reserve System. Therefore, I advise you to act very carefully with short positions, so as not to fall into the trap at the most annual lows. Only after the formation of a false breakdown at 1.3194, by analogy with what I understood above, you can sell GBP/USD further along with the trend. The main goal, in this case, will be to support 1.3138. The lack of activity on the part of buyers there, as well as the breakdown and reverse test of this level from the bottom up – all this will give an additional entry point into short positions to fall to the lows of this week, in the area of 1.3085. A more distant target will be the areas 1.3034 and 1.2976, where I recommend fixing the profits. However, these levels will be available only if the actual CPI value significantly exceeds the forecasts of economists. If the pair grows during the US session after weak US data, it is best to postpone sales. The demolition of 1.3194 may lead to a sharp increase in the pound against the background of new stop orders from sellers. In this case, I advise you to open short positions of GBP/USD after a false breakdown in the area of 1.3244. You can sell the pound immediately for a rebound from 1.3275, counting on a correction within the day by 20-25 points.
The COT reports (Commitment of Traders) for March 1 recorded a sharp increase in long positions and a reduction in short ones. This led to a reduction of the negative delta value to almost zero. However, you need to understand that now such reports are secondary, and the market is changing almost daily, flying by 100-200 points against the background of the ongoing geopolitical conflict that has affected almost the whole world. Most likely, the report next week will show a sharp demand for short positions, so it's best not to look too closely at the current figures yet. It also makes no sense to talk about what the policy of the Bank of England or the Federal Reserve System will be since, in the event of an aggravation of the military conflict, it will not matter at all. Now Russia and Ukraine have sat down at the negotiating table, and much will depend on the results of these meetings. The only thing that is clear for sure is high inflation in the UK, which will force the Bank of England to act more actively. Given the slowdown in economic growth and retaliatory sanctions from Russia, it is unlikely that the regulator will go for a sharper increase in interest rates - and this must be done, otherwise, inflation will devour not only the available incomes of the population but also sharply reduce them. The COT report for March 1 indicated that long non-commercial positions increased from the level of 42,249 to the level of 47,679, while short non-commercial positions decreased from the level of 48,058 to the level of 48,016. This led to the preservation of the negative value of the non-commercial net position at the level of -337 versus -5,809. The weekly closing price dropped to 1.3422 against 1.3592.
Signals of indicators:
Moving averages
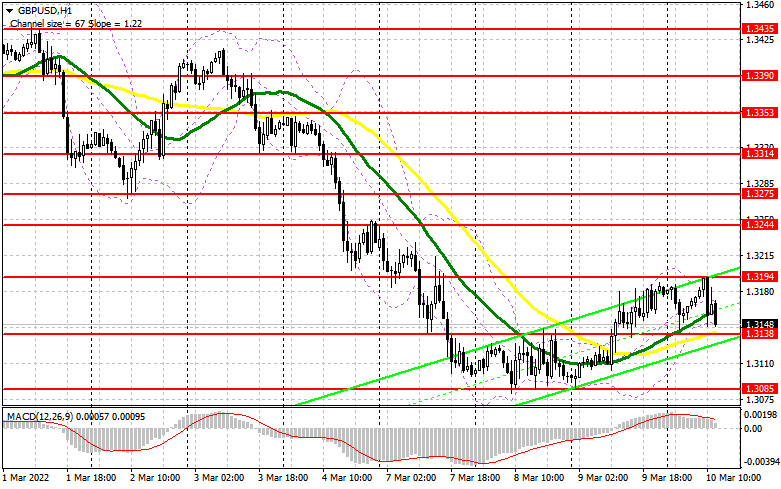
Trading is conducted above 30 and 50 daily moving averages, which indicates the beginning of an upward correction for the pair.
Note. The period and prices of moving averages are considered by the author on the hourly chart H1 and differ from the general definition of the classic daily moving averages on the daily chart D1.
Bollinger Bands
A break of the lower limit of the indicator in the area of 1.3138 will increase the pressure on the pound. A break of the upper limit of the indicator in the area of 1.3194 will lead to the growth of the pair.
Description of indicators
- Moving average (moving average determines the current trend by smoothing out volatility and noise). Period 50. The graph is marked in yellow.
- Moving average (moving average determines the current trend by smoothing out volatility and noise). Period 30. The graph is marked in green.
- MACD indicator (Moving Average Convergence / Divergence - moving average convergence/divergence) Fast EMA period 12. Slow EMA period 26. SMA period 9
- Bollinger Bands (Bollinger Bands). Period 20
- Non-profit speculative traders, such as individual traders, hedge funds, and large institutions that use the futures market for speculative purposes and meet certain requirements.
- Long non-commercial positions represent the total long open position of non-commercial traders.
- Short non-commercial positions represent the total short open position of non-commercial traders.
- Total non-commercial net posit


