EUR/USD 5M
The EUR/USD pair again showed almost perfect movement on Wednesday. This is exclusively thanks to the Ichimoku indicator and its lines Kijun-sen and Senkou Span B. Yesterday the pair went down about 80 points, while it began its downward movement exactly from Kijun-sen, and finished exactly near Senkou Span B. Despite the fact that these lines may change their location today, let's leave them here for now, because the euro/dollar pair is approaching the flat, and the Ichimoku indicator forms false signals in the flat. Therefore, let these lines play the role of extreme levels for the time being. Among the important events for today, we can single out only Federal Reserve Chairman Jerome Powell's speech, which did not give fundamentally new information. Powell and his colleagues have already answered the question of which way the Fed will look during 2022-2023. They can't provide any more important information at this time.
There were only two trading signals during Wednesday. But what! The pair bounced at the very beginning of the European trading session from the critical line (with an error of 1 point), forming a sell signal. This signal was canceled only at the beginning of the US session, when the price bounced off the Senkou Span B line (with an error of 2 points). Thus, a short position could bring a profit of about 60 points. But even at the signal of a rebound from Senkou Span B, it was necessary to open positions, this time a long one. They made it possible to earn about 30 more points, since the deal had to be closed manually near the end of the working day. As a result, 90 points of profit with the total volatility of the pair slightly more than 80.
COT report:
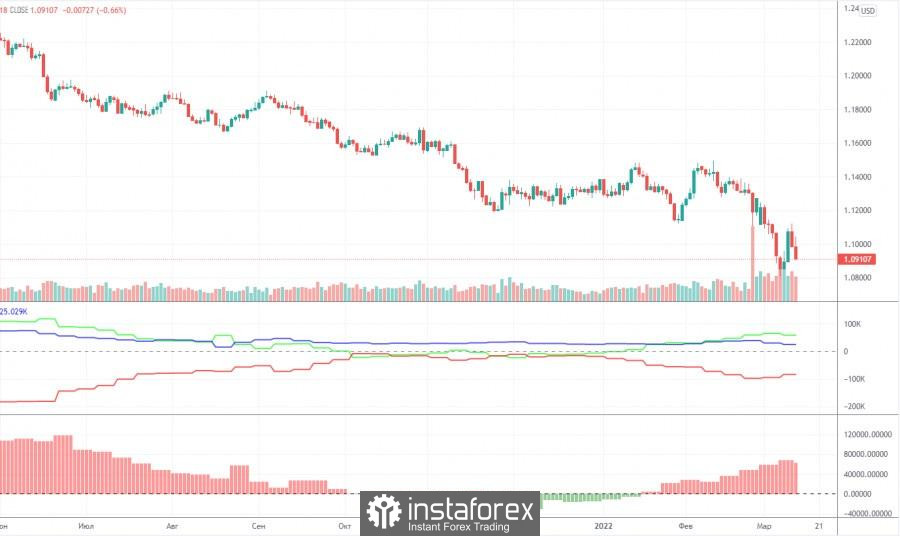
In the last two months, Commitment of Traders (COT) reports have signaled such changes in the mood of traders that absolutely did not correspond to what was actually happening in the foreign exchange market. Simply put, the euro continued to fall, while big commercial traders raised long positions. We said that such a divergence could arise due to the fact that the demand for the US currency increased sharply, which was simply higher than for the euro. However, the latest COT report showed that big players are also starting to change their preferences. During the last reporting week, the non-commercial group reduced the number of long positions by 40,000. That's a lot. The general mood of non-commercial traders still remains bullish, as the number of long positions exceeds the number of short positions by 19,000. However, trends are important to us. And now the trend is such that even major players can start selling the euro again. This is on top of the fact that the demand for the US dollar also remains high. Thus, the net position of the non-commercial group decreased significantly last week and now almost all factors speak in favor of a further fall in the euro currency. Therefore, the euro can now show growth from time to time only on the basis of technical necessity to adjust.
We recommend to familiarize yourself with:
Overview of the EUR/USD pair. March 24. The European currency still has nothing to cover.
Overview of the GBP/USD pair. March 24. Impressive somersaults of the British pound and two traps for traders at once.
Forecast and trading signals for GBP/USD on March 24. Detailed analysis of the movement of the pair and trading transactions.
EUR/USD 1H
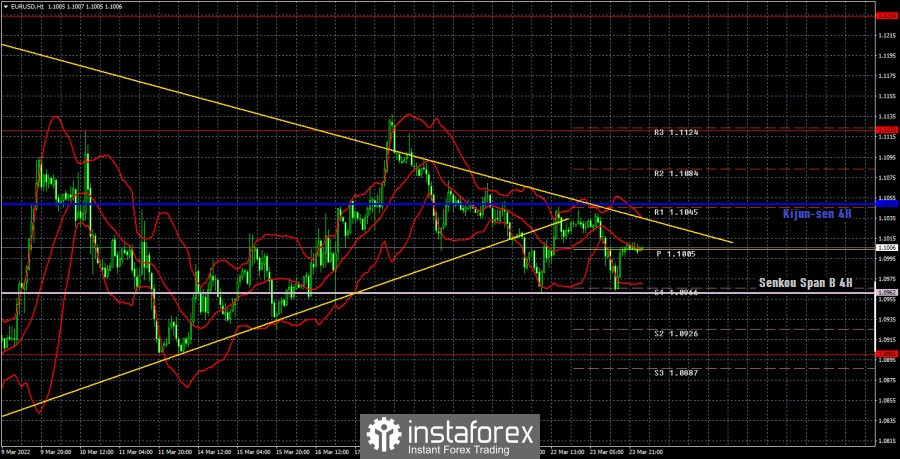
The descending trend line remains relevant on the hourly timeframe. At the moment, the price is stuck between the lines of the Ichimoku indicator, which may even mean the beginning of a flat. At least over the past two days, the pair has bounced off these lines four times perfectly in accuracy. Thus, it is necessary to focus now on these lines, which we will not move in the coming day. It should be remembered that the price has already overcome the downward trend line, but for now we consider that overcoming a false breakout. We allocate the following levels for trading on Thursday - 1.0806, 1.0901, 1.1122, 1.1234, as well as the Senkou Span B (1.0962) and Kijun-sen (1.1049) lines. There are also support and resistance levels, but no signals will be formed near them. The lines of the Ichimoku indicator may change their position during the day, which should be taken into account when searching for trading signals. Signals can be "bounces" and "breakthrough" levels - extremes and lines. Do not forget about placing a Stop Loss order at breakeven if the price went in the right direction of 15 points. This will protect you against possible losses if the signal turns out to be false. The calendars of macroeconomic events in the United States and the European Union are completely empty on March 24. Thus, traders will have nothing to react to, and the price may remain between the Kijun-sen and Senkou Span B lines during the day.
Explanations for the chart:
Support and Resistance Levels are the levels that serve as targets when buying or selling the pair. You can place Take Profit near these levels.
Kijun-sen and Senkou Span B lines are lines of the Ichimoku indicator transferred to the hourly timeframe from the 4-hour one.
Support and resistance areas are areas from which the price has repeatedly rebounded off.
Yellow lines are trend lines, trend channels and any other technical patterns.
Indicator 1 on the COT charts is the size of the net position of each category of traders.
Indicator 2 on the COT charts is the size of the net position for the non-commercial group.


