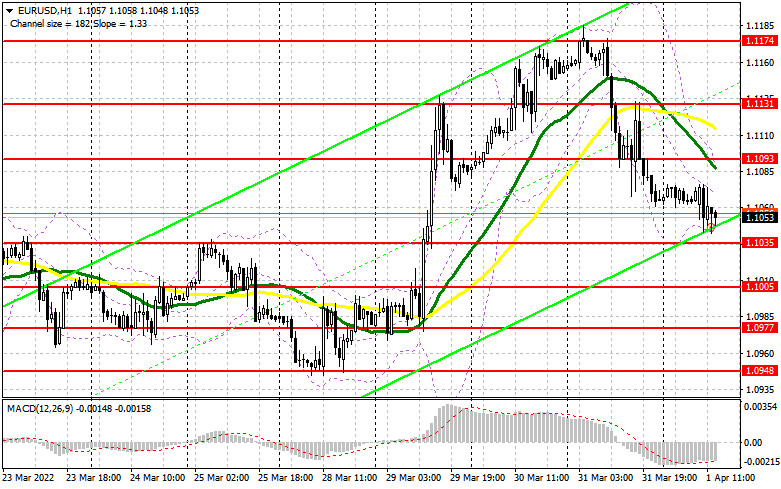
In my forecast this morning I drew your attention to the levels of 1.1035 and 1.1093 and recommended entering the market from them. Let's have a look at the 5-minute chart and analyze what happened. Despite the weak Eurozone manufacturing activity report, the data was not as weak as some economists expected. This kept the EUR/USD pair in a narrow sideways channel ahead of the US labor market report. Low volatility did not allow to reach the above-mentioned levels, so there were no signals to enter the market in the first half of the day. Technically, nothing has changed, as well as the trading strategy for the US session.
Long positions on EUR/USD:
The released Consumer Price Index for the euro zone has once again proved to the European Central Bank that delaying policy changes is dangerous. The euro zone's annual inflation rate jumped to 7.5% in March from 5.9% in February. It is one of the highest levels seen. Weak manufacturing activity reports for Germany, France and Italy did not give traders much optimism as they prepare for more important US labor market statistics and expect the US dollar to strengthen. The report on Non-Farm Payrolls in the US will determine the pair's future. A strong reading is likely to put pressure on the euro, which may lead to the breakthrough and the test of 1.1035. Only a false breakout at this level is likely to create the first entry point to buy the euro. To see a bullish trend continuation and a breakthrough of the March highs, bulls need to be active around 1.1093. The moving averages are located slightly above, which play on the sellers' side. If the US data appears to be weak, and the unemployment report is also expected, a pierce and a test of 1.1093 may form an additional buy signal and open the way for the pair's recovery to the area of 1.1131. Traders are advised to take profit at this level. A breakthrough of this level is likely to trigger sellers' stop-loss orders, opening a direct way to the highs of 1.1174 and 1.1227. If the pair declines and bulls show weak activity at 1.1035, it is better to postpone opening long positions. A false breakout of the low at 1.1005 would be the best buy scenario. Long positions in the euro can be opened on a pullback only from 1.0977, or lower near 1.0948, allowing an upward intraday correction of 30-35 pips.
Short positions on EUR/USD:
As it was expected, bears showed some activity after the weak eurozone data release, clearly hinting at problems in the economy in the near future. The market is not under the full control of bulls, and the US data may ruin their attempts to build a strong bullish trend this week. Bears need to hold the price below a very important resistance at 1.1093. By breaking this area through when the US jobs data comes out, bears can reverse the pair to the downside. Only a false breakout at 1.1093 may bring back the pressure on the euro and create a sell signal to continue sliding to support at 1.1035. If there is strong data from the US the pair may break through this level and trigger buyers' stop-loss orders. A breakthrough and a reverse test bottom/top of 1.1035 may form an additional sell signal, which will open a direct way to the lows of 1.1005 and 1.0977, where traders may lock in profits. In case of the euro growth and a lack of activity from bears at 1.1093, which is possible only in case of another positive news on the negotiations between Russia and Ukraine, bulls are likely to establish a new uptrend. If so, it is better not to rush selling the pair. Opening of short positions would be optimal if a false breakout occurs around 1.1131. Selling the EUR/USD pair on the rebound is possible from 1.1174, or higher near 1.1227, allowing a downward correction of 20-25 pips.
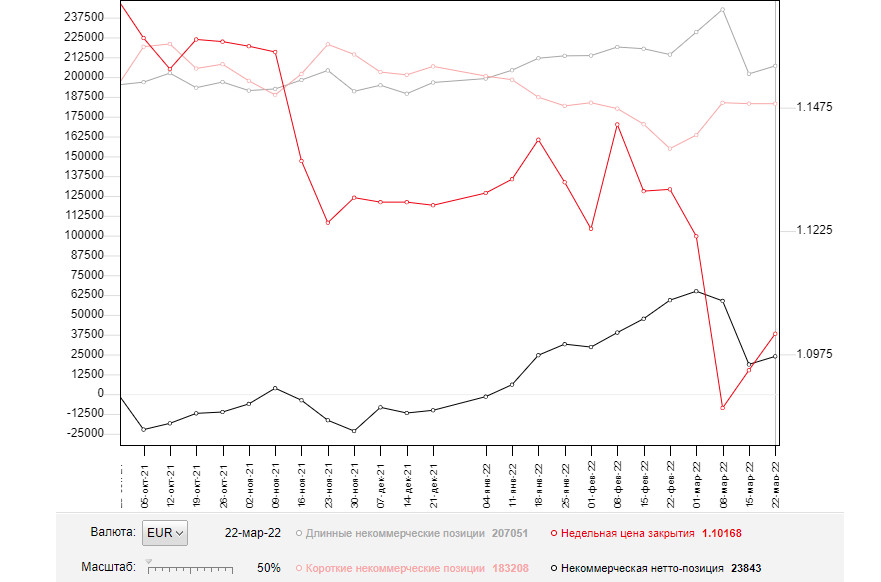
The COT (Commitment of Traders) report for March 22 showed that short positions reduced and long ones increased sharply. The pair is trading near new yearly lows and major support levels which is positive for the euro. However, if we take a look at the figures, we can see that short positions fell slightly. The pressure on EUR/USD returned after Fed Chairman Jerome Powell sharply changed his stance last week. The Chairman said on Monday that he expected a 50-point hike in key interest rates. Other representatives of the Federal Reserve supported this statement, which made market participants revise their outlooks. The risk of higher inflation in the US is the main reason for such changes in the policy. Meanwhile, the European Central Bank also held a meeting where President Christine Lagarde announced plans for a more aggressive tapering of economic support measures and raising interest rates. It added some optimism for the medium-term outlook of the euro, which is already heavily oversold against the US dollar. Positive results of the Russia-Ukraine meeting and decrease of the geopolitical tensions will play on bulls' side. The COT report indicates that long non-commercial positions rose to 207,051 from 202,040, while short non-commercial positions declined to 183,208 from 183,246. At the end of the week, total non-commercial net positioning was up to 23,843 against 18,794. The weekly closing price rose slightly to 1.1016 from 1.0942.
Indicator signals:
Moving averages
Trading is carried out near the 30-day and 50-day moving averages, indicating that bears attempt to take control over the market.
Note: The period and prices of moving averages are viewed by the author on the hourly chart and differ from the general definition of classic daily moving averages on the daily chart.
Bollinger Bands
If the pair rises, the middle band at 1.1115 will act as resistance.
Indicator description:
- Moving average (MA) determines the current trend by smoothing volatility and noise. Period 50. Colored yellow on the chart.
- Moving average (MA) determines the current trend by smoothing volatility and noise. Period 30. Colored green on the chart.
- Moving Average Convergence/Divergence (MACD). Fast EMA 12. Slow EMA 26. SMA 9.
- Bollinger Bands. Period 20
- Non-commercial traders are speculators such as individual traders, hedge funds, and large institutions who use the futures market for speculative purposes and meet certain requirements.
- Long non-commercial positions are the total long position of non-commercial traders.
- Non-commercial short positions are the total short position of non-commercial traders.
- Total non-commercial net position is the difference between short and long positions of non-commercial traders.


