In my forecast this morning, I drew your attention to the level of 1.0852 and recommended entering the market from it. Let's have a look at the 5-minute chart and analyze what happened. An unsuccessful attempt to break through 1.0852, at the beginning of the European session, created a buy signal for the European currency. At the time of writing, the pair rose by more than 40 pips, but bulls did not reach 1.0899. Considering that the technical pattern has not changed in the afternoon, I think we should keep the trading plan unchanged.
Long positions on EUR/USD:
Bulls are confidently holding the price above 1.0852. It seems that the buyers of risky assets are controlling the market. However, a larger upward correction in the second half of the day will help only profit-taking on short positions. The pair declined significantly from Monday's opening levels, and bears will not benefit from the stomping. Considering that only the Wholesale Inventories report is to be released during the US session, which is of no interest for traders, euro buyers can expect the pair to reach above 1.0899. Bulls need to hold the price above 1.0852, and only a false breakout at this level will form an entry point into long positions. As I mentioned earlier in the morning, the pair needs to grow and bulls should show some activity at 1.0899 to see a slowing of the downtrend. The moving averages, limiting the uptrend, pass through this level. A breakthrough and a top/bottom test of this level are likely to create an additional signal for opening long positions, which may allow the EUR/USD to recover to the area of 1.0936, above which it failed to break through yesterday. If the pair rises above this level, bulls may trigger bears' stop-loss orders, sending the pair to the highs of 1.0970 and 1.1007. With the pair falling and a lack of actions from bulls at 1.0852 and bears trying to fix the price near the weekly lows again in the afternoon, it is better to postpone opening longs. A false breakout of the low at 1.0810 might be the best buy scenario. You can also open long positions on a pullback from 1.0772, or even lower, near 1.0728, allowing an upward intraday correction of 30-35 pips.
Short positions on EUR/USD:
Bears failed to reach below 1.0852. However, it doesn't cancel their medium-term control over the market, so there is no particular reason to panic. Surely, profit-taking at the end of the week and the absence of strong fundamental statistics in the US might be the key factors, making bears act more passively, but it does not cancel the downtrend. Bears need to hold the price below the resistance at 1.0899, which the pair almost reached in the first half of the day. That's where the moving averages are located, which are playing on the sellers' side. So a false breakout at this level may bring back the pressure on the euro, and it might create a sell signal to continue sliding down to the new support at 1.0852. The pair should reach new daily swing lows to keep bearish momentum. If fresh US data appears to be strong, a breakout and a top/bottom reverse test of 1.0852 may form a sell signal, which is likely to open a direct way to the lows of 1.0810 and 1.0772, where traders can lock in profits. If the euro grows in the second half of the day, only the formation of a false breakout at 1.0899 can give the first sell signal. However, if bears show weak activity at this level, nothing bad will happen. A strong upward movement of the euro is expected only if there is positive news on the negotiations between Russia and Ukraine, which are unlikely to be released in the nearest future. Short positions at a false breakout near 1.0936 would be the best scenario. It is possible to sell the pair immediately on a rebound from 1.0970, or higher near 1.1007, allowing a downward correction of 25-30 pips.
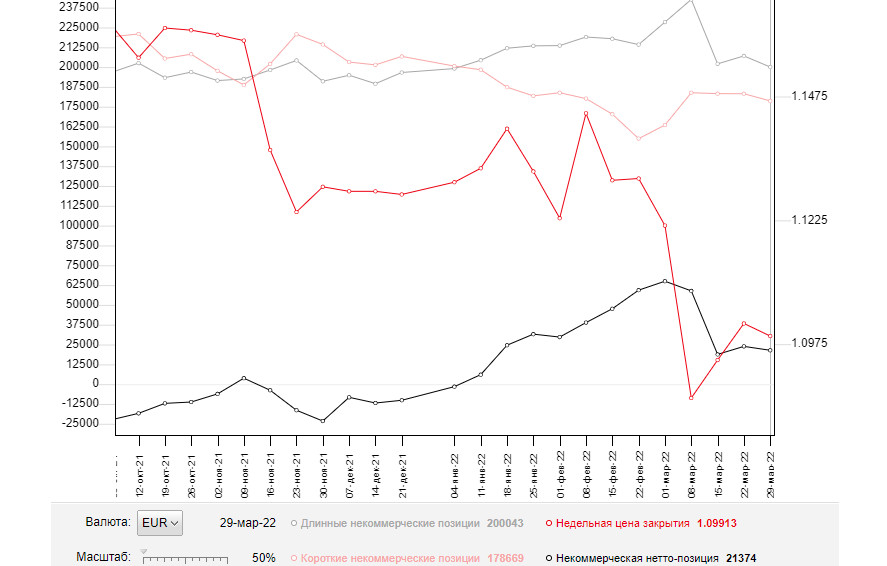
The COT (Commitment of Traders) report for March 29 showed a decrease in both short and long positions. Notably, there were more buyers than sellers from those who left the market. It indicates pessimism among market participants caused by the current geopolitical situation. Meanwhile, the ECB sees a risk of higher inflation in the eurozone as the main problem because inflation has already jumped to 7.5%. Last week, Christine Lagarde flagged that the regulator would taper the QE program and raise the key interest rate more aggressively. Against this background, the euro has a good mid-term prospect for growth. Today, it is significantly oversold against the US dollar. However, the lack of positive changes in the negotiations between Russia and Ukraine and growing geopolitical tensions have a negative impact on the euro. The economic problems in the eurozone amid high inflation and Russia's retaliatory sanctions (including the payment for gas in rubles) will continue to put pressure on the euro in the short term. Therefore, traders will hardly see a considerable increase in the pair. According to the COT report, the number of long non-commercial positions dropped to 200,043 from 207,051. At the same time, the number of short non-commercial positions decreased to 178,669 from 183,208. Since a drop in the number of short positions turned out to be more significant, the overall non-commercial net position fell to 21,374 from 23,843. The weekly close price also dwindled to 1.0991 from 1.1016.
Indicators' description
Moving averages
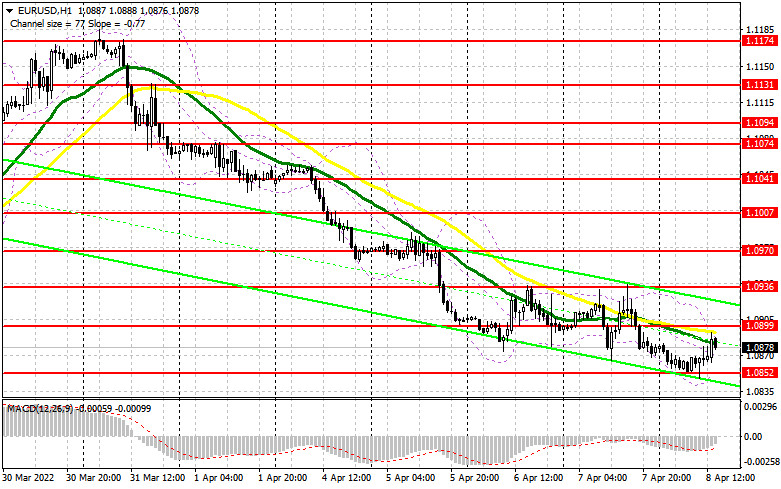
The pair is trading below 30- and 50-period moving averages, indicating that the euro may continue its downward movement.
Note. The author is analyzing the period and prices of moving averages on the 1-hour chart. So, it differs from the common definition of classic daily moving averages on the daily chart.
Bollinger Bands
In the case of growth, the upper boundary of the indicator around 1.0890 will act as resistance. If the indicator breaks through its lower boundary at 1.0852, it will lead to a larger decline.
Definitions of technical indicators
- Moving average recognizes an ongoing trend through leveling out volatility and market noise. A 50-period moving average is plotted yellow on the chart.
- Moving average identifies an ongoing trend through leveling out volatility and market noise. A 30-period moving average is displayed as the green line.
- MACD indicator represents a relationship between two moving averages that is a ratio of Moving Average Convergence/Divergence. The MACD is calculated by subtracting the 26-period Exponential Moving Average (EMA) from the 12-period EMA. A 9-day EMA of the MACD is called the "signal line".
- Bollinger Bands is a momentum indicator. The upper and lower bands are typically 2 standard deviations +/- from a 20-day simple moving average.
- Non-commercial traders - speculators such as retail traders, hedge funds, and large institutions who use the futures market for speculative purposes and meet certain requirements.
- Non-commercial long positions represent the total long open position of non-commercial traders.
- Non-commercial short positions represent the total short open position of non-commercial traders.
- The overall non-commercial net position balance is the difference between short and long positions of non-commercial traders.


