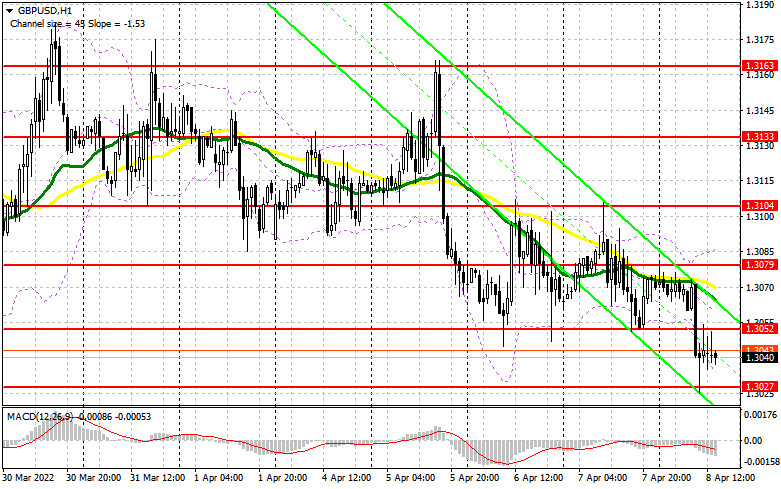
In the morning article, I highlighted the levels of 1.3052 and 1.3027 and recommended taking decisions with these levels in focus. Now let's look at the 5-minute chart and try to figure out what actually happened. The immediate breakout of 1.3052 occurred without an upward test. Therefore, I did not enter the market when the price declined from this level. I focused on 1.3027 as a false breakout enabled traders to open profitable long positions. As a result, the instrument returned to 1.3052, bringing speculators a 30 pip gain. A false breakout at 1.3052 will generate a sell signal. At the time of writing this article, the pound sterling took a nosedive from 1.3052, losing another 30 pips. It was testing again the support level of 1.3027. Bulls and bears will continue to tassel for this level today in the afternoon.
What is needed to open long positions on EUR/USD
The bearish trend is back after the pound sterling has broken below the support level of 1.3050. It is hard to say how deep it may fall. Bulls made an attempt to defend 1.3027. For some time, the price remained at this level. However, a rebound to 1.3052 increased pressure on GBP. It indicates the presence of major market players. In the afternoon, traders should be very careful when opening long positions. Even though the US will not publish any crucial reports, save for wholesale inventories data which is of least importance, the pair may break out of the sideways channel. If so, it will sink significantly. The bulls have a chance to regain momentum only because it is the end of the week. Only another false breakout at 1.3027 will provide a buy signal, similar to the one I discussed above. In this case, the price may return to 1.3052 and test again this range. Investors will rush to close short positions. Thus, the pound sterling may again enter the sideways channel. It is very important for bulls to close the week above 1.3052. Otherwise, they will lose momentum. A breakout and a downward test of 1.3052 against the background of weak US data will give an additional entry point in long positions. As a result, the price may approach 1.3079. A more distant target will be the 1.3104 level where I recommend profit-taking. However, it will be quite difficult for the pair to reach this level in the current conditions. Only positive geopolitical news may help the pair return to the upper border of the sideways channel. If the pound/dollar pair declines to 1.3027 and bulls fail to protect this level, the price will fall to a new low of 1.3001. I would advise entering the market at this level only if there is a false breakout. It is also possible to open long positions against the trend immediately for a rebound from 1.2960 or even a lower low at 1.2911, keeping in mind an intraday correction of 30-35 pips.
What is needed to open short positions on EUR/USD
Bears are now dominating the market sentiment even if their control is mostly seen in intraday trading. However, the likelihood of a steep decrease persists. The primary task of sellers is to protect the resistance level of 1.3052. The moving averages are passing in the negative territory above this level. A false breakout at this level, similar to the one I mentioned above, will give another entry point into short positions. It will also boost the bear market. The pair is likely to dip to 1.3027. I assume that bulls will hardly be able to defend this level for the second time. This is why bears could easily push the price below this level. It will trigger an upward test. It will provide an additional sell signal and increase pressure on the pair, opening the way to 1.3001. Only a breakout and an upward test of this level may help demolish buyers' stop orders. It will be a signal to sell at a low of 1.2960, where I recommend profit-taking. If the pair rises during the US session and bears show no activity at 1.3052, it will significantly affect the pound sterling. However, it is better to postpone short positions until 1.3079. It is also recommended to open short positions at this level only in case of a false breakout. It is possible to sell GBP/USD immediately on a rebound from a high of 1.3104 or even a higher high of 1.3133, keeping in mind an intraday correction of 30-35 pips.
COT report
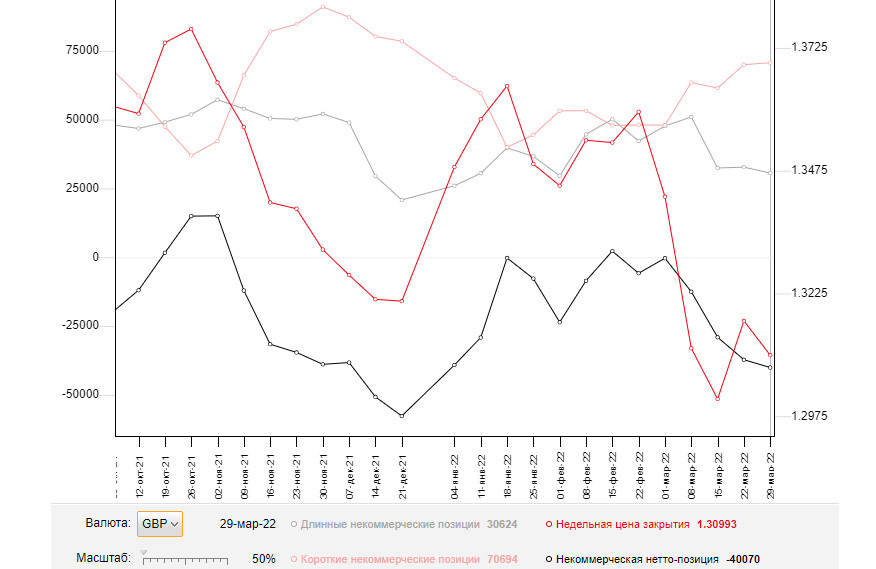
The COT reports (Commitment of Traders) for March 29 logged an increase in short positions and a decrease in long ones. Bulls are losing momentum because of concerns about the resilience of the UK economy and the risks of high inflation. Analysts suppose that consumer prices may soar amid falling UK household incomes. They note that the situation will only worsen as inflation risks, which adversely affect the economy, are now quite difficult to assess. In addition, the dovish rhetoric of the BoE governor seems inappropriate. Traders refrain from opening long positions amid risk aversion. They expect a further increase in the interest rate. Bulls may take the upper hand provided that there will be positive news on the progress in negotiations between Russia and Ukraine. Do not forget about the aggressive policy of the Federal Reserve System, which continues to fuel demand for the US dollar amid significant risks of economic recession in the second half of the year. The COT report for March 29 revealed that the number of long non-commercial positions dropped to 30,624 from 32,753, while the number of short non-commercial positions jumped 70,694 from 69,997. It increased the negative value of the non-commercial net position from -37,244 to -40,070. The weekly closing price decreased to 1.3099 against 1.3169.
Signals of technical indicators
Moving averages
GBP/USD is trading below 30- and 50-period moving averages, indicating the bear market.
Remark. The author is analyzing a period and prices of moving averages on the 1-hour chart. So, it differs from the common definition of classic daily moving averages on the daily chart.
Bollinger Bands
In case of a decline, 1.3020 will act as support.
Definitions of technical indicators
Moving average recognizes an ongoing trend through leveling out volatility and market noise. A 50-period moving average is plotted yellow on the chart. Moving average identifies an ongoing trend through leveling out volatility and market noise. A 30-period moving average is displayed as the green line. MACD indicator represents a relationship between two moving averages that is a ratio of Moving Average Convergence/Divergence. The MACD is calculated by subtracting the 26-period Exponential Moving Average (EMA) from the 12-period EMA. A 9-day EMA of the MACD called the "signal line". Bollinger Bands is a momentum indicator. The upper and lower bands are typically 2 standard deviations +/- from a 20-day simple moving average. Non-commercial traders - speculators such as retail traders, hedge funds and large institutions who use the futures market for speculative purposes and meet certain requirements. Non-commercial long positions represent the total long open position of non-commercial traders. Non-commercial short positions represent the total short open position of non-commercial traders. The overall non-commercial net position balance is the difference between short and long positions of non-commercial traders.


