empty
12.01.2023 06:37 PM
Technical analysis of GBP/USD for January 12, 2023

This image is no longer relevant

Overview:

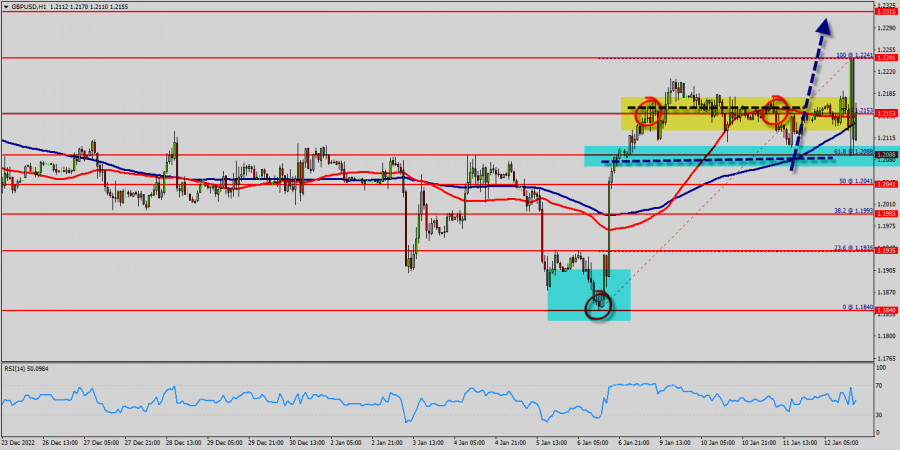
The GBP/USD pair hit the weekly pivot point and resistance 1, because of the series of relatively equal highs and equal lows. But the pair has risen in order to top at the point of 1.2088. Hence, the major resistance was already set at the level of 1.2241. Moreover, the double top is also coinciding with the major resistance this week.

Additionally, the RSI is still calling for a strong bullish market as well as the current price is also above the moving average 100. Therefore, it will be advantageous to buy above the support area of 1.2088 with the first target at 1.2241.

From this point, if the pair closes above the weekly pivot point of 1.2088, the GBP/USD pair may resume it movement to 1.2241 to test the weekly resistance 1.

Today, the GBP/USD pair has broken resistance at the level of 1.2088 which acts as support now.

Thus, the pair has already formed minor support at 1.2153. The strong support is seen at the level of 1.2088 because it represents the weekly support 1.

Equally important, the RSI and the moving average (100) are still calling for an uptrend. Therefore, the market indicates a bullish opportunity at the level of 1.2088 in the H1 chart.

Also, if the trend is buoyant, then the currency pair strength will be defined as following: GBP is in an uptrend and USD is in a downtrend. Buy above the minor support of 1.2088 with the first target at 1.2241 and continue towards 1.2315 (the weekly resistance 2).

However, be careful of excessive bullish movements. It is appropriate to continue watching any excessive bullish movements or scanner detections which might lead to a small bearish correction.

The GBP/USD pair traded higher and closed the day in positive territory near the price of 1.2153. Today it was trading in a narrow range of 1.2153 - 1.2315, staying close to yesterday's closing price.

The GBP/USD pair faced strong support at the level of 1.2088 because resistance became support. The strong support has been already faced at the level of 1.2088 and the pair is likely to try to approach it in order to test it again.

The level of 1.2088 represents a weekly pivot point for that it is acting as minor support this week. On the hourly chart, the GBP/USD pair broke through and fixed above the moving average line MA (100) H1 (1.2153).

The situation is similar on the four-hour chart. Based on the foregoing, it is probably worth sticking to the north direction in trading, and while the GBP/USD pair remains above MA 100 H1, it may be necessary to look for entry points to buy for the formation of a correction.

According to the previous events, the GBP/USD pair is still moving between the levels of 1.2153 and 1.2315; for that we expect a range of +162 pips in coming hours.

On the other hand, if the price closes below the minor support, the best location for the stop loss order is seen below 1.2315; for that, the price will fall into the bearish market in order to go further towards the strong support at 1.2088 to test it again.

Furthermore, the level of 1.2041 will form a double bottom. Stop loss should always be taken into account, accordingly, it will be of beneficial to set the stop loss below the last bottom at 1.2041.

Select timeframe
5
min
15
min
30
min
1
hour
4
hours
1
day
1
week
Earn on cryptocurrency rate changes with InstaForex
Download MetaTrader 4 and open your first trade
  • Grand Choice
    Contest by
    InstaForex
    InstaForex always strives to help you
    fulfill your biggest dreams.
    JOIN CONTEST

Recommended Stories

Bitcoin: Reaching New Highs May Stall

Bitcoin's price briefly exceeded the new all-time high of $111,000 but failed to consolidate above it. The token, along with the broader crypto market, continues to receive support from dollar

Pati Gani 09:49 2025-05-22 UTC+2

Technical Analysis of Intraday Price Movement of Nasdaq 100 Index, Thursday May 22, 2025.

With the appearance of Divergence between the Nasdaq 100 index price movement which formed a Double Top with the Stochastic Oscillator indicator plus confirmation with its price movement which moved

Arief Makmur 07:01 2025-05-22 UTC+2

Technical Analysis of Intraday Price Movement of USD/CHF Main Currency Pairs, Thursday May 22, 2025

As we can see on the 4-hour chart of USD/CHF main currency pair, some interesting information appears, namely first the appearance of Divergence between the price movement of USD/CHF with

Arief Makmur 07:01 2025-05-22 UTC+2

EUR/USD Forecast for May 22, 2025

On Wednesday, the euro successfully consolidated above the 1.1266 level and the balance indicator line. The next target levels are 1.1420 and 1.1535. The Marlin oscillator is about to enter

Laurie Bailey 05:06 2025-05-22 UTC+2

GBP/USD Forecast for May 22, 2025

Yesterday's inflation data for April in the UK surprised market participants. Core CPI jumped from 3.4% y/y to 3.8% y/y versus an expected 3.6% y/y, while headline CPI reached 3.5%

Laurie Bailey 05:06 2025-05-22 UTC+2

USD/JPY Forecast for May 22, 2025

The USD/JPY pair has been declining for eight consecutive days — a pattern not seen since 2019. However, we recently saw two five-week declines in July 2024 and November–December 2023

Laurie Bailey 05:06 2025-05-22 UTC+2

XAG/USD. Analysis and Forecast

Silver is rising toward the $33.25 level, consolidating near the upper boundary of its familiar range. The emergence of buying on pullbacks, a recent rebound from the 100-day Simple Moving

Irina Yanina 18:43 2025-05-21 UTC+2

Trading Signals for EUR/USD for May 21-25, 2025: sell below 1.1370 (200 EMA - overbought)

Early in the American session, the EUR/USD pair is trading around 1.1327, showing fading bullish strength. Having reached the top of the uptrend channel, EUR/USD is going through a technical

Dimitrios Zappas 17:50 2025-05-21 UTC+2

Trading Signals for GOLD (XAU/USD) for May 21-25, 2025: buy above $3,281 (200 EMA - 6/8 Murray)

Early in the American session, gold is trading around 3,304, above the 6/8 Murray level, and within the uptrend channel formed on May 14. Gold is expected to continue rising

Dimitrios Zappas 17:47 2025-05-21 UTC+2

Forecast for EUR/USD on May 21, 2025

On Tuesday, the EUR/USD pair managed to consolidate above the resistance zone of 1.1260–1.1282, which had previously triggered three pullbacks. As a result, the euro's upward movement continued

Samir Klishi 11:19 2025-05-21 UTC+2
Can't speak right now?
Ask your question in the chat.
Widget callback
 

Dear visitor,

Your IP address shows that you are currently located in the USA. If you are a resident of the United States, you are prohibited from using the services of InstaFintech Group including online trading, online transfers, deposit/withdrawal of funds, etc.

If you think you are seeing this message by mistake and your location is not the US, kindly proceed to the website. Otherwise, you must leave the website in order to comply with government restrictions.

Why does your IP address show your location as the USA?

  • - you are using a VPN provided by a hosting company based in the United States;
  • - your IP does not have proper WHOIS records;
  • - an error occurred in the WHOIS geolocation database.

Please confirm whether you are a US resident or not by clicking the relevant button below. If you choose the wrong option, being a US resident, you will not be able to open an account with InstaForex anyway.

We are sorry for any inconvenience caused by this message.