In my morning forecast, I paid attention to the 1.0519 level and recommended making decisions on entering the market from it. Let's look at the 5-minute chart and figure out what happened there. An unsuccessful attempt to grow after the release of statistics on the eurozone led to a false breakdown in the area of 1.0519 and to a signal to sell the euro, which resulted in a 25-point sell-off. After updating the daily low, the pair returned to the 1.0519 area again and formed a similar false breakdown - again a sell signal, but at the same time, the downward movement was only about 20 points. And what were the entry points for the pound this morning?
To open long positions on EURUSD, you need:
The sharp jump in producer prices in the eurozone did not surprise anyone, while the data on the labor market and the unemployment rate coincided with economists' forecasts, which kept trade within a narrow side channel. Considering that the technical picture has not changed in any way for the second half of the day, I advise you to rely on the previous levels adhering to the previous strategy. In the case of strong US data and changes in the volume of production orders, the pair will quickly fall to 1.0473, which we did not reach quite a bit in the first half of the day. The optimal scenario for buying from there will only be the formation of a false breakdown to return the initiative, which the bulls have completely lost. In case of weak statistics, we can expect the pair to recover back to 1.0519, where the moving averages are already playing on the sellers' side. A breakout and a test of 1.0519 from top to bottom form a new signal for entering long positions, opening the possibility of returning to the area of 1.0565, where I recommend fixing the profits. A more distant target will be the 1.0619 area. If EUR/USD declines and there are no buyers at 1.0473, and this is more likely, especially considering tomorrow's Fed meeting and central bank policy, it is best to postpone long positions. The optimal scenario for buying would be a false breakdown near the new annual low of 1.0426. It is possible to open long positions on the euro immediately for a rebound only from 1.0394, or even lower - around 1.0347 with the aim of an upward correction of 30-35 points within a day.
To open short positions on EURUSD, you need:
Sellers control the market, actively protecting 1.0519. They now face a rather difficult task to further preserve the initiative, and for this, they need to update the annual lows below 1.0473. The optimal scenario for opening short positions will be the formation of a false breakdown at the level of 1.0519, similar to what I discussed above. This will lead to the first sell signal and a return of pressure on the pair to reduce to 1.0473. In the case of strong statistics on the United States, most likely in the afternoon, the whole fight will unfold. A breakdown and consolidation below 1.0473, as well as a reverse test from the bottom up, will give a signal to sell the euro, followed by reaching annual lows in the area of 1.0426 and with the prospect of updating 1.0394, where I recommend fixing the profits. A more distant target will be the 1.0347 area, but such a scenario is possible only after the bullish reaction of dollar buyers to tomorrow's Fed meeting. If the euro rises during the American session and there are no bears at 1.0519, nothing terrible will happen, but I expect a sharper upward jerk. In this case, the optimal scenario will be short positions when forming a false breakdown in the area of 1.0565. You can sell EUR/USD immediately on a rebound from 1.0619, or even higher - around 1.0652 with the aim of a downward correction of 25-30 points.
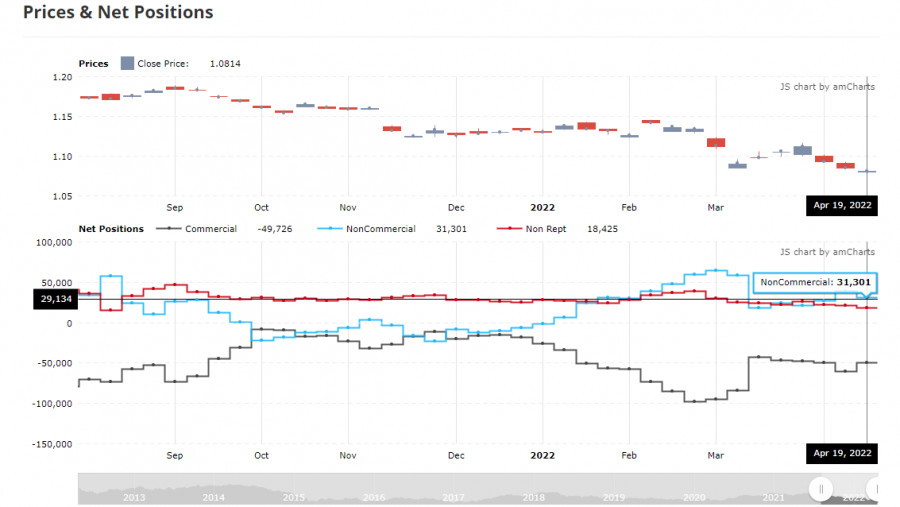
The COT report (Commitment of Traders) for April 19 recorded a sharp increase in short positions and a reduction in long ones. Recent statements by representatives of central banks have led to a new active sale of risky assets, as it became obvious to everyone that serious problems in the economies of developed countries cannot be avoided this year. And although the president of the European Central Bank noted in her speeches that the regulator plans to fully complete the bond purchase program by the end of the second quarter of this year, hinting at a rate hike in early autumn, this was not enough to support the euro. The more aggressive policy of the Federal Reserve System and expectations of a May rate hike of 0.75% at once support the dollar. Another problem is the threat of another economic paralysis due to strict quarantine restrictions in China against the background of a new wave of COVID-19, which has already led to a large-scale disruption in the supply chains of European and Asian countries. As a result, the US dollar continues to be in demand, which will continue to push the EUR/USD pair down. Russia's new active actions on the territory of Ukraine and the lack of progress in resolving the conflict also put pressure on the euro and will continue to do so. The COT report indicates that long non-commercial positions decreased from the level of 221,645 to the level of 221,003, while short non-commercial positions increased sharply from the level of 182,585 to the level of 189,702. It is worth noting that the decline of the euro makes it more attractive to investors, so the minimum closure of long positions is not surprising. At the end of the week, the total non-commercial net position decreased and amounted to 34,055 against 39,060. The weekly closing price collapsed and amounted to 1.0814 against 1.0855.
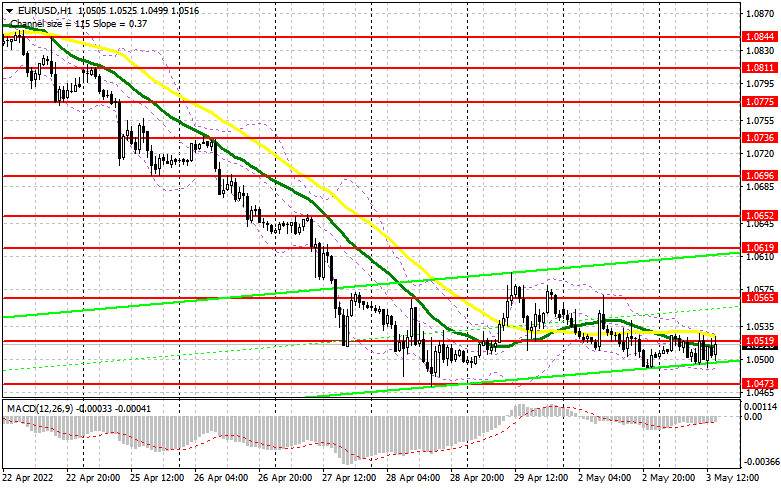
Signals of indicators:Moving averagesTrading is conducted around 30 and 50 daily moving averages, which indicates the lateral nature of the market.Note: The period and prices of moving averages are considered by the author on the hourly chart H1 and differ from the general definition of the classic daily moving averages on the daily chart D1.Bollinger BandsIn the case of a decline, the average border of the indicator around 1.0490 will act as support.Description of indicators
- Moving average (moving average determines the current trend by smoothing out volatility and noise). Period 50. The graph is marked in yellow.
- Moving average (moving average determines the current trend by smoothing out volatility and noise). Period 30. The graph is marked in green.
- MACD indicator (Moving Average Convergence / Divergence - moving average convergence/divergence) Fast EMA period 12. Slow EMA period 26. SMA period 9
- Bollinger Bands (Bollinger Bands). Period 20
- Non-profit speculative traders, such as individual traders, hedge funds, and large institutions use the futures market for speculative purposes and to meet certain requirements.
- Long non-commercial positions represent the total long open position of non-commercial traders.
- Short non-commercial positions represent the total short open position of non-commercial traders.
- Total non-commercial net position is the difference between the short and long positions of non-commercial traders.


