empty
 
 
01.06.2022 11:51 AM
EUR/USD: analysis and forecast for June 1, 2022

Hello, deal colleagues!

Yesterday was the last trading day of the spring. The summer is coming, but how hot it can be in the foreign exchange market will become clear in the very near future. Before analyzing the trading results of May, let's find out what information may somewhat affect the market.

The European Union has recently announced the sixth package of anti-Russian sanctions that includes an embargo on two-thirds of Russian oil imports. For countries like Hungary that rely on Russian hydrocarbons, this is going to be a serious challenge.

As for the macroeconomic calendar, consumer prices in the eurozone rose more than expected, which could push the ECB to adopt aggressive rhetoric and increase the pace of tightening. President Lagarde who delivers a speech today may cast some light on the regulator's future plans. In addition, FOMC members Bullard and Williams will give interviews. Anyway, we will hardly learn anything new from their statements. Let's now turn to the technical picture of EUR/USD.

Monthly

This image is no longer relevant

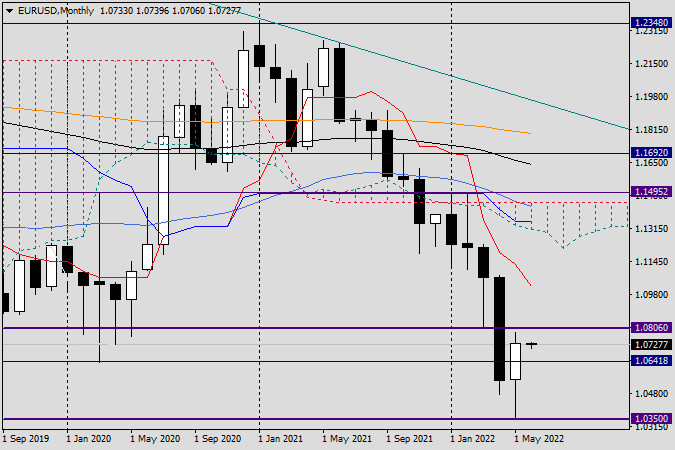
The pair was bullish on the last trading day of the month. According to the chart, the price went up from the technical level of 1.0350 and closed the month at 1.0732. In general, the body of the latest candlestick with a very long lower shadow indicates an impending reversal. Meanwhile, the candlestick itself is very similar to the bull hammer pattern. It looks similar because ideally, such a candlestick has no upper shadow. Although the May candlestick has one, it is very small. Nevertheless, based on the monthly chart, EUR/USD is highly likely to continue rising.

Daily

This image is no longer relevant

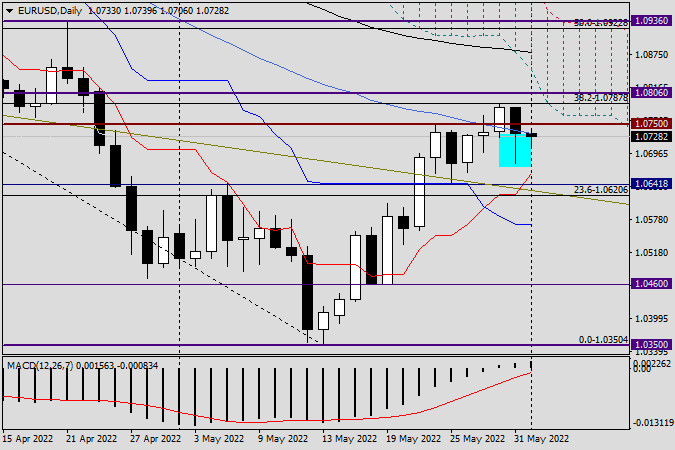
Yesterday, the market was volatile as expected. The pair descended to 1.0679 but encountered strong support there. It helped partially recoup losses, as indicated by the long lower shadow of the latest candlestick. In spite of that, the price closed below the blue MA 50 and the strong technical level of 1.0750, which used to be resistance. The important level of 1.0800 is now seen as new resistance. To be more precise, it lies at 1.0787, in line with the highs of May 30. As for the outlook, the previous one turned out to be accurate.

As a reminder, it was unwise to go log below resistance, and due to the high likelihood of a pullback, buying could have been considered around 1.0700. Given that the technical picture remains the same, long positions could be opened on small pullbacks to 1.0710, 1.0680, and perhaps 1.0660, which is in line with the red Tenkan line of the Ichimoku indicator. Today, the pair has already pulled back to 1.0706 and is now trying to reverse up. In this light, risky buying could be considered at current prices. Selling should be postponed until strong candlestick signals are made in this or lower time frames.

Have a nice trading day!

Ivan Aleksandrov,
Analytical expert of InstaForex
© 2007-2025
Earn on cryptocurrency rate changes with InstaForex
Download MetaTrader 4 and open your first trade
  • Grand Choice
    Contest by
    InstaForex
    InstaForex always strives to help you
    fulfill your biggest dreams.
    JOIN CONTEST
  • Chancy Deposit
    Deposit your account with $3,000 and get $10000 more!
    In January we raffle $10000 within the Chancy Deposit campaign!
    Get a chance to win by depositing $3,000 to a trading account. Having fulfilled this condition, you become a campaign participant.
    JOIN CONTEST
  • Trade Wise, Win Device
    Top up your account with at least $500, sign up for the contest, and get a chance to win mobile devices.
    JOIN CONTEST
  • 100% Bonus
    Your unique opportunity to get a 100% bonus on your deposit
    GET BONUS
  • 55% Bonus
    Apply for a 55% bonus on your every deposit
    GET BONUS
  • 30% Bonus
    Receive a 30% bonus every time you top up your account
    GET BONUS

Recommended Stories

Can't speak right now?
Ask your question in the chat.
Widget callback