Analysis of Thursday's deals:
30M chart of the EUR/USD pair
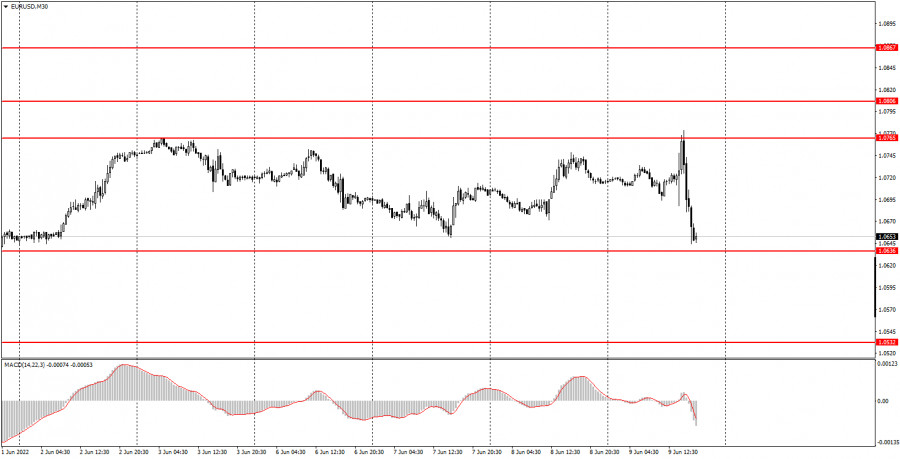
The EUR/USD currency pair continued to trade in the same horizontal channel on Thursday. The only change on the 30-minute timeframe is that we moved the upper border of the channel a little higher, to the level of 1.0765. Now this border is almost perfect, as it passes through two price peaks at once. Today's volatility was very high - more than 130 points. However, there is absolutely nothing to be surprised about here. Firstly, the pair still remained inside the horizontal channel. Secondly, such a movement was provoked by the European Central Bank meeting and the announcement of its results. I would like to note right away that, from our point of view, the market worked out the results absolutely illogically. But the results themselves were twofold. The ECB did not raise any of the rates, but announced the end of the APP stimulus program from July 1, and also announced rate hikes in July and September. Considering that no one expected the ECB to raise the rate in June, we can say that the results turned out to be hawkish. Therefore, they had to support the European currency. However, the euro grew only at the beginning, and then stumbled upon the level of 1.0765 and fell.
5M chart of the EUR/USD pair
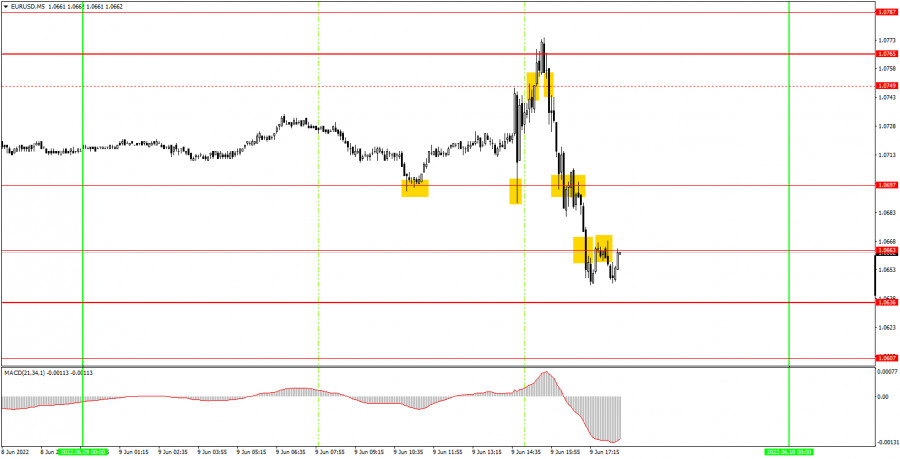
The technical picture on the 5-minute timeframe looks quite complicated due to the movements that were provoked by the results of the ECB meeting. As you can see in the chart above, for most of the European trading session, the pair moved quite calmly and even formed a good buy signal near the level of 1.0697. Further, volatile movements began, the direction of which could not be predicted. First, the pair rose to the level of 1.0749, then collapsed to 1.0697, then rose again to 1.0749 and overcame it, and then collapsed by 130 points. Thus, there is no need to talk about any clear and unambiguous reaction to the results of the ECB meeting. Therefore, all trading signals that formed after this event should have been ignored. Even the latest signals, during which the fundamental background no longer had such a strong impact on the pair. Consequently, only the very first signal could be worked out, which had to be closed manually before the announcement of the results of the central bank's meeting. Profit on this deal amounted to 25-35 points.
How to trade on Friday:
The pair continues to trade inside the horizontal channel on the 30-minute timeframe, so the technical picture has not changed over the past day. As long as the price is between the levels of 1.0636 and 1.0765, there is no need to count on a trend movement. Even the ECB meeting could not lead to the exit of the euro quotes from the specified range. On the 5-minute TF, it is recommended to trade at the levels of 1.0607, 1.0636, 1.0663, 1.0697, 1.0765, 1.0787-1.0806, 1.0837. When passing 15 points in the right direction, you should set Stop Loss to breakeven. There will be nothing interesting in the European Union in macroeconomic or fundamental terms. Meanwhile, the inflation report will be published in America, which is very important and can provoke a strong market reaction. It is impossible to say now which one, so you need to be ready for any movements.
Basic rules of the trading system:
1) The signal strength is calculated by the time it took to form the signal (bounce or overcome the level). The less time it took, the stronger the signal.
2) If two or more deals were opened near a certain level based on false signals (which did not trigger Take Profit or the nearest target level), then all subsequent signals from this level should be ignored.
3) In a flat, any pair can form a lot of false signals or not form them at all. But in any case, at the first signs of a flat, it is better to stop trading.
4) Trade deals are opened in the time period between the beginning of the European session and until the middle of the American one, when all deals must be closed manually.
5) On the 30-minute TF, using signals from the MACD indicator, you can trade only if there is good volatility and a trend, which is confirmed by a trend line or a trend channel.
6) If two levels are located too close to each other (from 5 to 15 points), then they should be considered as an area of support or resistance.
On the chart:
Support and Resistance Levels are the Levels that serve as targets when buying or selling the pair. You can place Take Profit near these levels.
Red lines are the channels or trend lines that display the current trend and show in which direction it is better to trade now.
The MACD indicator (14,22,3) consists of a histogram and a signal line. When they cross, this is a signal to enter the market. It is recommended to use this indicator in combination with trend lines (channels and trend lines).
Important speeches and reports (always contained in the news calendar) can greatly influence the movement of a currency pair. Therefore, during their exit, it is recommended to trade as carefully as possible or exit the market in order to avoid a sharp price reversal against the previous movement.
Beginners on Forex should remember that not every single trade has to be profitable. The development of a clear strategy and money management are the key to success in trading over a long period of time.


