Analysis of Friday's deals:
30M chart of the EUR/USD pair
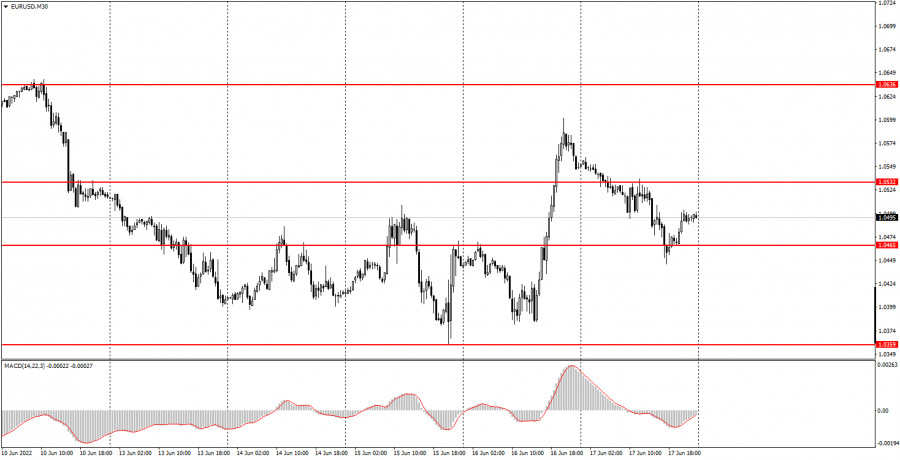
The EUR/USD currency pair started a downward correction on Friday, which was about the same size as the previous upward movement. As a result, by the end of the day the pair was again near the level of 1.0465. Those macroeconomic reports, which were published on Friday, had no effect on the pair's movement. Inflation in the European Union for the month of May was no different in the second estimate from the first. Industrial production in the US in May turned out to be worse than expected, but this did not affect the strengthening of the US currency throughout the day. Thus, at this time, the pair is again very close to its local lows, from which it is near 20-year lows. There is no trend line or channel at this time. Formally, it would be possible to form an upward trend line, but at the moment the upward movement lasts only a little more than two days. This is clearly not a trend. Moreover, given the fundamental and macroeconomic background, it will be extremely difficult for the euro to continue to grow. This week we expect a high for corrective growth with targets slightly higher than the previous local peak, that is, slightly above 1.0600.
5M chart of the EUR/USD pair
The technical picture doesn't look too bad on the 5-minute timeframe, but it's not perfect either. The first three sell signals were almost identical as the price bounced off the 1.0532 level three times. Each time it went down at least 15 points, so the first two short positions should have had Stop Loss set to breakeven, on which they were closed. With the third sell signal, everything is more complicated, since the first two turned out to be false. It should not have been worked out, but it was after it that a strong downward movement began. The next sell signal was formed near the level of 1.0465 and turned out to be false again, as the price could not go down even 15 points. And the next buy signal was formed too late, it should not have been worked out. Therefore, in the worst case, novice traders ended the day with a minimal loss. At best, if they worked out the third sell signal near the level of 1.0532, in a small profit.
How to trade on Monday:
The pair started a powerful upward movement on the 30-minute timeframe, but could already complete it. So far, the formal upward trend remains, but settling below the level of 1.0465, most likely, will mean a resumption of the global downward trend. There will be a very small number of important fundamental and macroeconomic events next week, so volatility should decrease slightly. On the 5-minute TF, it is recommended to trade at the levels of 1.0400, 1.0465, 1.0532, 1.0564, 1.0607, 1.0636. When passing 15 points in the right direction, you should set Stop Loss to breakeven. No important event or report in the European Union and the United States on Monday. Thus, beginners will have nothing to pay attention to during the day. But we can understand the mood of the market. If it takes the pair below the level of 1.0465, then the price may return to 1.0359.
Basic rules of the trading system:
1) The signal strength is calculated by the time it took to form the signal (bounce or overcome the level). The less time it took, the stronger the signal.
2) If two or more deals were opened near a certain level based on false signals (which did not trigger Take Profit or the nearest target level), then all subsequent signals from this level should be ignored.
3) In a flat, any pair can form a lot of false signals or not form them at all. But in any case, at the first signs of a flat, it is better to stop trading.
4) Trade deals are opened in the time period between the beginning of the European session and until the middle of the American one, when all deals must be closed manually.
5) On the 30-minute TF, using signals from the MACD indicator, you can trade only if there is good volatility and a trend, which is confirmed by a trend line or a trend channel.
6) If two levels are located too close to each other (from 5 to 15 points), then they should be considered as an area of support or resistance.
On the chart:
Support and Resistance Levels are the Levels that serve as targets when buying or selling the pair. You can place Take Profit near these levels.
Red lines are the channels or trend lines that display the current trend and show in which direction it is better to trade now.
The MACD indicator (14,22,3) consists of a histogram and a signal line. When they cross, this is a signal to enter the market. It is recommended to use this indicator in combination with trend lines (channels and trend lines).
Important speeches and reports (always contained in the news calendar) can greatly influence the movement of a currency pair. Therefore, during their exit, it is recommended to trade as carefully as possible or exit the market in order to avoid a sharp price reversal against the previous movement.
Beginners on Forex should remember that not every single trade has to be profitable. The development of a clear strategy and money management are the key to success in trading over a long period of time.


