empty
05.07.2022 04:00 PM
EUR/USD analysis on July 5. The wave pattern has become much more complicated, and now a new five-wave series can be built.

This image is no longer relevant

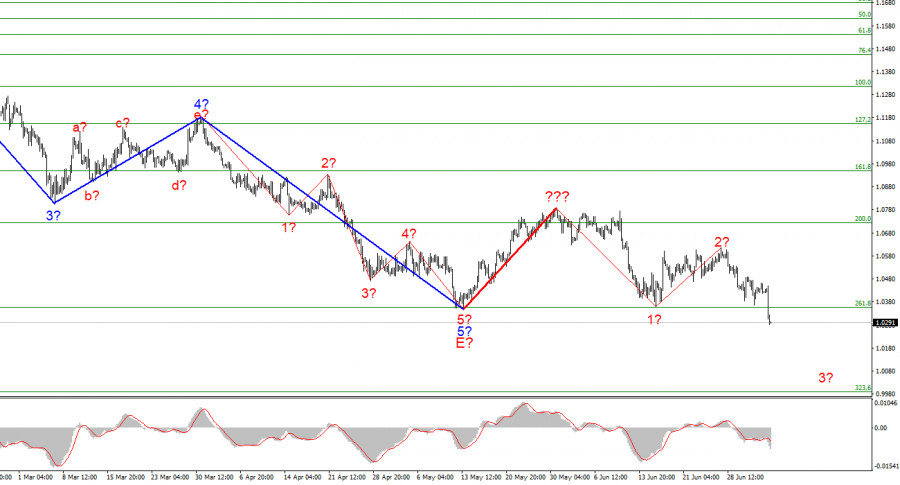
As a result of today's decline of about 200 basis points, the wave markings on the 4-hour chart of the euro/dollar instrument have grown more complicated. Consequently, a successful attempt was made to surpass the Fibonacci level of 261.8%, which was also the low of the waves E and b. It is already evident that these waves are likely not E and b, but the current market sentiment is gaining prominence. A few days ago, we had a fantastic, promising wave pattern consisting of a five-wave descending structure. Instead of constructing at least three upward correction waves, the market opted to resume selling the instrument, indicating the secondary importance of wave analysis at this moment. Occasionally, the market completely disregards the waves. However, I want to remind you that the market frequently disregards the news background and numerous technical signs. The key is to recognize that this has occurred promptly and adapt to the new market circumstances. Now that one corrective wave has been identified with a red line, the instrument may construct a new five-wave falling series. On a broader scale, the wave markup appears unintelligible. Thus I propose focusing on the lowest wave order presently.

The euro currency began the week with optimism, which rapidly disintegrated.

Tuesday saw a decline of 140 basis points in the euro/dollar exchange rate relative to the day's opening price. There was no news context on Monday, and on Tuesday, the business activity index in the European Union's services sector declined from 56.1% to 53.3% in June. Such a significant decline could reduce demand for the euro currency, but not to the extent that the instrument breaks the wave marking or falls by 140 points, in my opinion. In the end, business activity is not a report on the Gross Domestic Product, inflation, or a meeting of the ECB or Fed. I believe it has everything to do with the gloomy market sentiment, which persists unabatedly. If this is accurate, the news environment may not affect market sentiment in the coming weeks when the following five-wave descending structure is being constructed. As evidenced by the beginning of the week, the rhetoric about an American recession did not influence the market's willingness to increase dollar demand. Therefore, why pay attention to the news background if the tool is heading in one direction? A report on retail sales will be revealed in the European Union tomorrow, but I have a feeling that neither the market nor investors will care. The ISM index is more significant for the US services sector, but the euro can only count on a tiny rebound in the context of a new segment of a downward trend.

General conclusions.

Based on the analysis, I conclude that the building of the segment with the declining slope has resumed. If so, it is now viable to sell the instrument with goals at the estimated 0.9988 level, which corresponds to the Fibonacci level of 323.6%, for each "down" MACD signal, based on the development of wave 3. A successful attempt to surpass the level of 261.8% signals the market's readiness for stronger instrument sales and the cancellation of the scenario involving the creation of rising structures.

Chin Zhao,
Analytical expert of InstaForex
© 2007-2025
Select timeframe
5
min
15
min
30
min
1
hour
4
hours
1
day
1
week
Earn on cryptocurrency rate changes with InstaForex
Download MetaTrader 4 and open your first trade
  • Grand Choice
    Contest by
    InstaForex
    InstaForex always strives to help you
    fulfill your biggest dreams.
    JOIN CONTEST

Recommended Stories

EUR/USD Analysis on April 25, 2025

The wave pattern on the 4-hour EUR/USD chart has shifted into a bullish formation. It's safe to say that this transformation occurred solely due to the new U.S. trade policy

Chin Zhao 20:26 2025-04-25 UTC+2

GBP/USD Analysis on April 25, 2025

The wave pattern on the GBP/USD chart has also transformed into a bullish, impulsive structure—"thanks" to Donald Trump. The wave picture closely resembles that of the EUR/USD pair. Until February

Chin Zhao 20:21 2025-04-25 UTC+2

GBP/USD Analysis on April 24, 2025

The wave pattern for GBP/USD has also transformed into a bullish, impulsive structure—"thanks" to Donald Trump. The wave structure is nearly identical to that of EUR/USD. Until February

Chin Zhao 20:18 2025-04-24 UTC+2

EUR/USD Analysis on April 24, 2025

The wave pattern on the 4-hour chart of EUR/USD has transformed into an upward, impulsive structure. I believe there is little doubt that this transformation occurred solely

Chin Zhao 20:14 2025-04-24 UTC+2

EUR/USD Analysis on April 23, 2025

The wave structure on the 4-hour chart for EUR/USD has transitioned into a bullish, impulsive formation. I believe no one doubts that this transformation occurred solely

Chin Zhao 18:44 2025-04-23 UTC+2

GBP/USD Analysis on April 23, 2025

The wave structure on the GBP/USD chart has also shifted to a bullish, impulsive form — "thanks" to Donald Trump. The wave pattern is nearly identical to that of EUR/USD

Chin Zhao 18:40 2025-04-23 UTC+2

GBP/USD Analysis on April 22, 2025

The wave pattern on the GBP/USD chart has also transformed into a bullish, impulsive structure — all "thanks" to Donald Trump. The wave pattern is nearly identical to that

Chin Zhao 20:05 2025-04-22 UTC+2

EUR/USD Analysis on April 21, 2025

The wave structure on the 4-hour chart for EUR/USD has transformed into a bullish formation. I believe there's little doubt that this transformation occurred solely due to the new U.S

Chin Zhao 19:46 2025-04-21 UTC+2

GBP/USD Analysis on April 21, 2025

The wave structure for GBP/USD has also transformed into a bullish, impulsive formation—"thanks" to Donald Trump. The wave picture is nearly identical to that of EUR/USD. Up until February

Chin Zhao 19:44 2025-04-21 UTC+2

Weekly Forecast Based on Simplified Wave Analysis for GBP/USD, AUD/USD, USD/CHF, EUR/JPY, AUD/JPY, and the US Dollar Index — April 21st

GBP/USD Analysis: Since the beginning of this year, GBP/USD has been forming an upward wave on the daily chart. The pair has now reached the boundaries of a wide potential

Isabel Clark 09:31 2025-04-21 UTC+2
Can't speak right now?
Ask your question in the chat.
Widget callback
 

Dear visitor,

Your IP address shows that you are currently located in the USA. If you are a resident of the United States, you are prohibited from using the services of InstaFintech Group including online trading, online transfers, deposit/withdrawal of funds, etc.

If you think you are seeing this message by mistake and your location is not the US, kindly proceed to the website. Otherwise, you must leave the website in order to comply with government restrictions.

Why does your IP address show your location as the USA?

  • - you are using a VPN provided by a hosting company based in the United States;
  • - your IP does not have proper WHOIS records;
  • - an error occurred in the WHOIS geolocation database.

Please confirm whether you are a US resident or not by clicking the relevant button below. If you choose the wrong option, being a US resident, you will not be able to open an account with InstaForex anyway.

We are sorry for any inconvenience caused by this message.