empty
14.07.2022 04:12 PM
EUR/USD analysis on July 14. Inflation in the US has increased, and the euro currency is falling again.

This image is no longer relevant

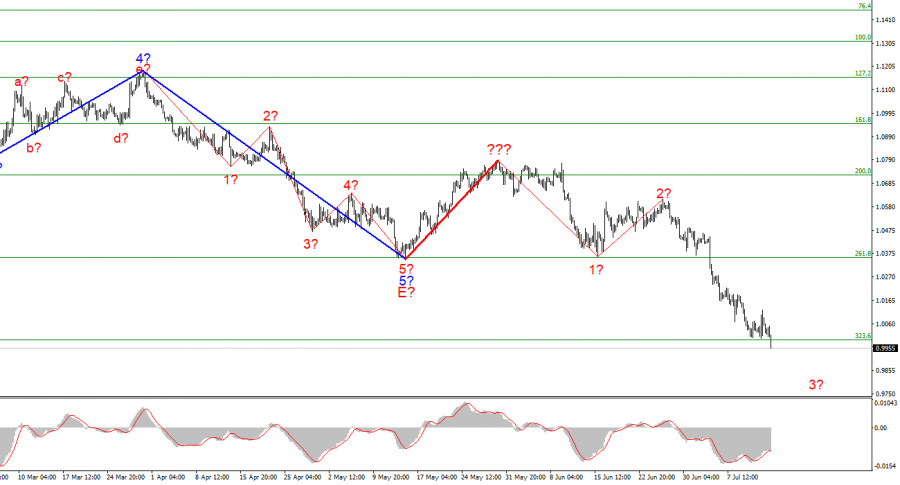
The wave marking of the 4-hour chart for the euro/dollar instrument became more complicated after the quotes fell by almost 300 basis points last week. Thus, a successful attempt was made to break through the 261.8% Fibonacci level, which was also the low of the waves E and b. Now it is clear that these waves are not E and b, but the market sentiment comes first in importance. We had an excellent, promising wave layout just a week ago, which contained a classic five-wave descending structure. Instead of building at least three correction waves up, the market preferred to resume selling the instrument, indicating the secondary importance of wave analysis. Now we have one correction wave marked with a red line, and the instrument can build a new five-wave descending series. I recommend paying attention to the lowest wave order now because wave marking looks very difficult on a larger scale. If the current wave markup is correct, then the decline in quotes continues within wave 3. Wave 4, which could have started its construction yesterday, has been canceled.

The euro broke through price parity with the dollar.

The euro/dollar instrument declined by 110 basis points on Thursday. Yesterday, a report on inflation in the United States was released, which I recommended paying close attention to. As it turned out, not in vain, since this report has changed a lot in the market. In particular, a correction wave could have started its construction yesterday, which required increased demand for the euro. And this could happen if inflation showed a slowdown. But it did not show and rose to 9.1% y/y, which was higher than market expectations. Towards Wednesday evening, the European currency still managed to rise slightly, but already that evening, the demand for it began to decline again, and now the instrument has broken through its last low and, for the first time in many years and decades, has fallen below the 1.0000 mark.

There is no news background on the European Union and the USA today. But this does not prevent the market from continuing to reduce demand for the euro and raise the dollar. The current wave marking is being worked out perfectly so far, and the targets of the descending wave set are up to 94 figures. It is up to this level that the euro currency may fall over the next weeks if the foreign exchange market does not change. But it's very difficult for me even to guess what might change. The ECB and the Fed continue to stick to their plans. The Fed is aggressively raising interest rates, and the ECB is not doing anything. The military-political conflict between Ukraine and Russia persists. Europe is on the verge of a gas embargo, with this already on the part of Russia. The situation remains very complicated and "acute," and at the same time, unstable. No one can say what will happen in a few weeks, and the market prefers to transfer its assets to the most stable currencies at such times. The dollar is such.

General conclusions.

Based on the analysis, I conclude that the construction of the downward trend section has been resumed and continues. If so, it is now possible to sell the instrument with targets near the calculated mark of 0.9397, which equates to 423.6% Fibonacci, for each MACD signal "down," counting on the construction of waves 3 or 5. An unsuccessful attempt to break through the level of 323.6% will indicate the temporary unavailability of the market for new sales and the construction of corrective waves 4. But I think the attempt will be successful.

This image is no longer relevant

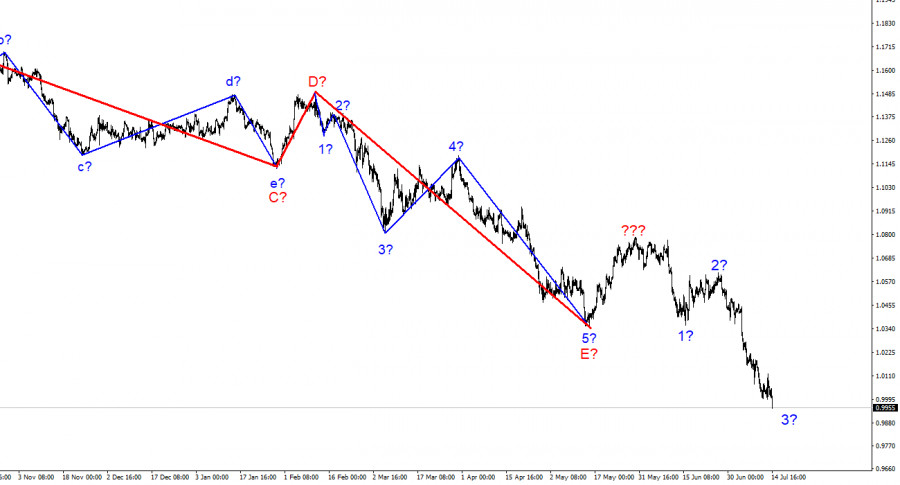
At the higher wave scale, the wave marking of the descending trend segment becomes noticeably more complicated and lengthens. It can take on almost any length, so I think it's best to isolate three and five-wave standard wave structures and work on them.

Chin Zhao,
Analytical expert of InstaForex
© 2007-2025
Select timeframe
5
min
15
min
30
min
1
hour
4
hours
1
day
1
week
Earn on cryptocurrency rate changes with InstaForex
Download MetaTrader 4 and open your first trade
  • Grand Choice
    Contest by
    InstaForex
    InstaForex always strives to help you
    fulfill your biggest dreams.
    JOIN CONTEST

Recommended Stories

GBP/USD Analysis on May 30, 2025

The wave structure for GBP/USD continues to indicate the development of an upward impulsive wave pattern. The wave pattern is almost identical to that of EUR/USD. Until February

Chin Zhao 17:31 2025-05-30 UTC+2

EUR/USD Analysis on May 29, 2025

The wave pattern on the 4-hour chart for EUR/USD has transformed into an upward structure and remains so. It is clear that this shift has occurred solely

Chin Zhao 20:18 2025-05-29 UTC+2

GBP/USD Analysis on May 29, 2025

The wave structure for the GBP/USD pair continues to indicate the formation of a bullish impulse wave pattern. The wave configuration closely mirrors that of EUR/USD. Until February

Chin Zhao 20:17 2025-05-29 UTC+2

EUR/USD Analysis on May 28, 2025

The wave structure on the 4-hour EUR/USD chart has transformed into a bullish configuration and continues to follow that trajectory. There is little doubt that this transformation was driven solely

Chin Zhao 19:08 2025-05-28 UTC+2

EUR/USD Analysis on May 27, 2025

The wave pattern on the 4-hour chart for EUR/USD has shifted into a bullish structure and continues to hold that form. I believe there's little doubt that this transformation

Chin Zhao 20:47 2025-05-27 UTC+2

GBP/USD Analysis on May 27, 2025

The wave structure for GBP/USD continues to indicate the formation of a bullish impulsive wave pattern. The wave setup is almost identical to that of EUR/USD. Until February

Chin Zhao 20:30 2025-05-27 UTC+2

GBP/USD Analysis on May 26, 2025

The wave structure for GBP/USD continues to indicate the development of a bullish impulse wave pattern. The wave picture closely resembles that of EUR/USD. Until February 28, we observed

Chin Zhao 16:49 2025-05-26 UTC+2

Weekly Forecast Using Simplified Wave Analysis for GBP/USD, AUD/USD, USD/CHF, EUR/JPY, Ethereum, and U.S. Dollar Index on May 26th

GBP/USD Analysis: Since January, the British pound has been trending upward. The current incomplete segment began on April 8. Within this wave, the final segment remains unfinished. The price

Isabel Clark 11:23 2025-05-26 UTC+2

Weekly Forecast Using Simplified Wave Analysis: EUR/USD, USD/JPY, GBP/JPY, USD/CAD, NZD/USD, and Gold on May 26th

EUR/USD Analysis: Since April, the euro's primary pair has been forming a descending horizontal pennant. From a strong, potentially reversal zone on the daily timeframe in mid-May, the price began

Isabel Clark 11:15 2025-05-26 UTC+2

GBP/USD Analysis on May 22, 2025

For the GBP/USD pair, the wave structure continues to suggest the development of a bullish impulsive trend. The wave pattern is nearly identical to that of EUR/USD. Until February

Chin Zhao 18:12 2025-05-22 UTC+2
Can't speak right now?
Ask your question in the chat.
Widget callback
 

Dear visitor,

Your IP address shows that you are currently located in the USA. If you are a resident of the United States, you are prohibited from using the services of InstaFintech Group including online trading, online transfers, deposit/withdrawal of funds, etc.

If you think you are seeing this message by mistake and your location is not the US, kindly proceed to the website. Otherwise, you must leave the website in order to comply with government restrictions.

Why does your IP address show your location as the USA?

  • - you are using a VPN provided by a hosting company based in the United States;
  • - your IP does not have proper WHOIS records;
  • - an error occurred in the WHOIS geolocation database.

Please confirm whether you are a US resident or not by clicking the relevant button below. If you choose the wrong option, being a US resident, you will not be able to open an account with InstaForex anyway.

We are sorry for any inconvenience caused by this message.