Analysis of Monday's deals:
30M chart of the EUR/USD pair
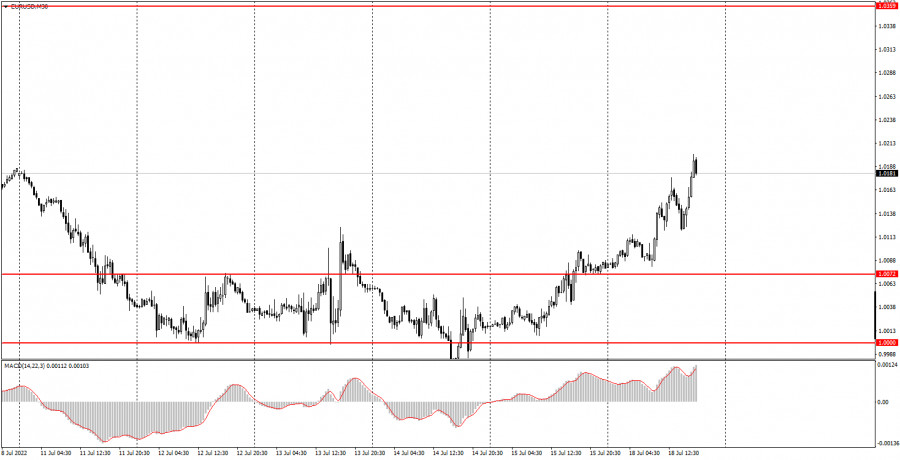
The EUR/USD currency pair showed such a movement on Monday that we were even somewhat surprised. Taking into account the fact that there were no macroeconomic and fundamental backgrounds that day, the euro somehow managed to grow by about 100 points. Of course, we would not open champagne on this occasion to celebrate the start of a new upward trend. Still, two days of growth is too little to talk about the end of a 2-year downward trend. However, the bulls have made a good bid to finally end the hegemony of the US dollar. Unfortunately, we still do not believe that the euro is capable of showing strong and sustained growth at this time. The Federal Reserve remains much more aggressive in its monetary approach than the European Central Bank, and the geopolitical conflict in Ukraine has a greater impact on the EU economy than on the US economy. Thus, we believe that Monday's growth could be due to the fact that the ECB meeting will take place this week, at which the rate will be raised with a 99% probability by 0.25%. It is possible that by the end of the week we will see a new fall in the euro.
5M chart of the EUR/USD pair
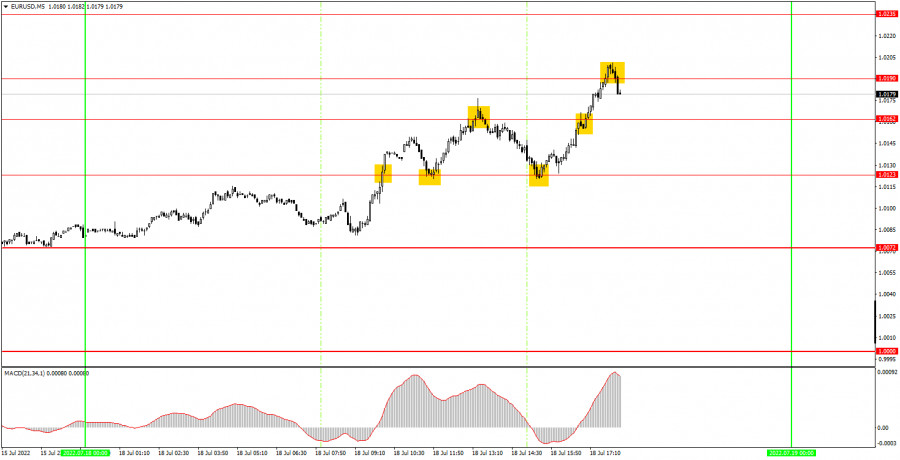
Trading signals on the 5-minute timeframe were quite good on Monday. Unfortunately, the upward movement could not be caught from the very beginning. The first buy signal was formed only when the price settled above the level of 1.0123. Then it managed to return to this level and only after that it resumed growth, having reached the level of 1.0162. One should close long positions near this level and open short ones. The price went down back to the level of 1.0123 on a sell signal, and bounced off it for the second time in a day, forming a new buy signal. Thus, short positions should have been closed here and new long positions should have been opened. Subsequently, the price began to grow, overcame the level of 1.0162 and reached the next target level of 1.0190, where it was necessary to take profit on longs. The last sell signal near 1.0190 should not have been worked out, as it was formed too late. In principle, not a single false signal was formed during the day, and the profit was about 80 points, which is just fine for a day like Monday.
How to trade on Tuesday:
The downward trend continues on the 30-minute time frame, but since there is no trend line or channel at the moment, this moment is far from obvious. We believe that the euro could fall at any moment. Nevertheless, the pair's growth is also possible now, so the buy signals should not be ignored. On the 5-minute TF on Tuesday it is recommended to trade at the levels of 1.0000, 1.0072, 1.0123, 1.0162-1.0190, 1.0235, 1.0277, 1.0354. When passing 15 points in the right direction, you should set Stop Loss to breakeven. The European Union will publish a report on inflation for June. And this is the only and in any case the most important event of the week. The reaction to it can be quite strong, but it is impossible to predict it. You need to be alert and ready for any development of events.
Basic rules of the trading system:
1) The signal strength is calculated by the time it took to form the signal (bounce or overcome the level). The less time it took, the stronger the signal.
2) If two or more deals were opened near a certain level based on false signals (which did not trigger Take Profit or the nearest target level), then all subsequent signals from this level should be ignored.
3) In a flat, any pair can form a lot of false signals or not form them at all. But in any case, at the first signs of a flat, it is better to stop trading.
4) Trade deals are opened in the time period between the beginning of the European session and until the middle of the US one, when all deals must be closed manually.
5) On the 30-minute TF, using signals from the MACD indicator, you can trade only if there is good volatility and a trend, which is confirmed by a trend line or a trend channel.
6) If two levels are located too close to each other (from 5 to 15 points), then they should be considered as an area of support or resistance.
On the chart:
Support and Resistance Levels are the Levels that serve as targets when buying or selling the pair. You can place Take Profit near these levels.
Red lines are the channels or trend lines that display the current trend and show in which direction it is better to trade now.
The MACD indicator (14,22,3) consists of a histogram and a signal line. When they cross, this is a signal to enter the market. It is recommended to use this indicator in combination with trend lines (channels and trend lines).
Important speeches and reports (always contained in the news calendar) can greatly influence the movement of a currency pair. Therefore, during their exit, it is recommended to trade as carefully as possible or exit the market in order to avoid a sharp price reversal against the previous movement.
Beginners on Forex should remember that not every single trade has to be profitable. The development of a clear strategy and money management are the key to success in trading over a long period of time.


