Analysis of Monday's deals:
30M chart of the GBP/USD pair
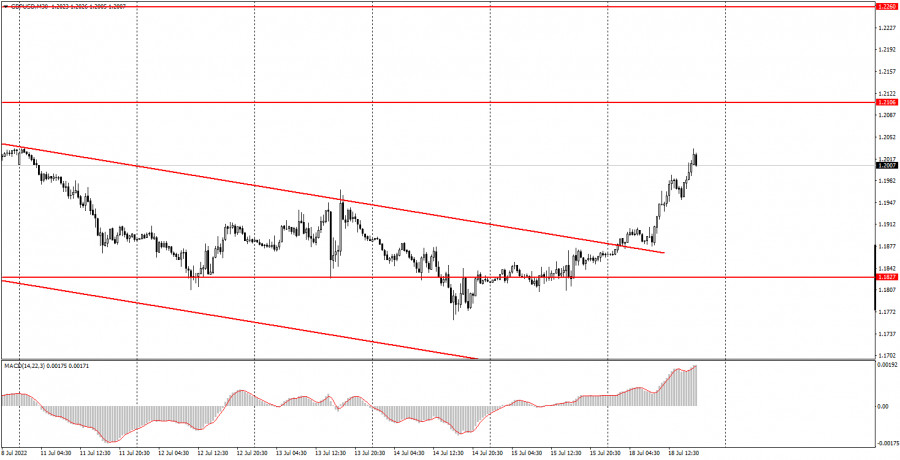
The GBP/USD pair also rose rather unexpectedly on Monday. The price confidently overcame the upper limit of the descending channel, so there were no questions at this moment. Recall that we warned about a possible "flat exit" of quotes from the channel. In this case, the buy signal would be weak. But in our case, the price quite confidently left the descending channel, so it was possible to open long positions even on this signal. In general, nothing happened on Monday that could provoke the growth of the British pound by 150 points. There was not a single interesting report or other event in either the UK or the US. In our EUR/USD review, we suggested that the euro's rise could be related to the upcoming European Central Bank meeting, but this meeting has nothing to do with the British pound or the dollar. And there are no meetings of the Bank of England or the Federal Reserve scheduled for this week. Thus, it looks like we are dealing with the usual technical correction after a long decline. If so, then it may be short-lived, like almost all corrections within the current downward trend, which has been going on for more than a year and a half.
5M chart of the GBP/USD pair
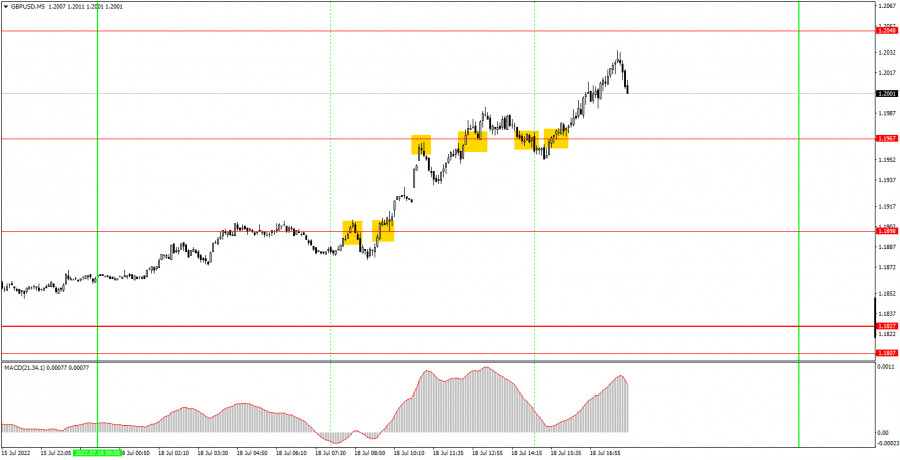
The movements and signals on the 5-minute timeframe were quite good on Monday, although not perfect. The first sell signal in the form of a rebound from the level of 1.1898 turned out to be false. The price could not go down even 20 points, so Stop Loss could not be set to breakeven. This was followed by a buy signal near the same level, which has already brought profit to novice traders, as the pair rose to the target level of 1.1967 (error 2 points) and rebounded from it, forming a new sell signal. Unfortunately, it also turned out to be false, but this time the pound managed to go down 20 points, so the Stop Loss had to be set to breakeven. The next buy signal near the 1.1967 level also turned out to be false, but this time the pair again failed to go in the right direction for at least 20 points, so this deal also received a small loss. Two more signals were formed near the level of 1.1967, the last of which could bring profit to novice traders, but these signals should no longer be worked out, since by the time they were formed near the level of 1.1967, two false signals had already been formed. As a result, due to false signals, the total profit of the day did not exceed 5-10 points.
How to trade on Tuesday:
The pair left the descending channel very quickly and cheerfully on the 30-minute TF, so an upward movement may be observed for some time. We do not believe that it will be long-term, as it seems that the market just started taking profits on short positions, which led to a rollback to the upside. On the 5-minute TF on Tuesday it is recommended to trade at the levels 1.1807-1.1827, 1.1898, 1.1967, 1.2048, 1.2106, 1.2170. When the price passes after opening a deal in the right direction for 20 points, Stop Loss should be set to breakeven. The release of reports on unemployment and wages is scheduled for Tuesday in the UK. This is not the most important data at this time, so we do not expect a serious reaction to it. In the evening there will be a speech by Bank of England Chairman Andrew Bailey, who is also extremely rarely eloquent. There will be no important events or publications in the US on Tuesday at all.
Basic rules of the trading system:
1) The signal strength is calculated by the time it took to form the signal (bounce or overcome the level). The less time it took, the stronger the signal.
2) If two or more deals were opened near a certain level based on false signals (which did not trigger Take Profit or the nearest target level), then all subsequent signals from this level should be ignored.
3) In a flat, any pair can form a lot of false signals or not form them at all. But in any case, at the first signs of a flat, it is better to stop trading.
4) Trade deals are opened in the time period between the beginning of the European session and until the middle of the US one, when all deals must be closed manually.
5) On the 30-minute TF, using signals from the MACD indicator, you can trade only if there is good volatility and a trend, which is confirmed by a trend line or a trend channel.
6) If two levels are located too close to each other (from 5 to 15 points), then they should be considered as an area of support or resistance.
On the chart:
Support and Resistance Levels are the Levels that serve as targets when buying or selling the pair. You can place Take Profit near these levels.
Red lines are the channels or trend lines that display the current trend and show in which direction it is better to trade now.
The MACD indicator (14,22,3) consists of a histogram and a signal line. When they cross, this is a signal to enter the market. It is recommended to use this indicator in combination with trend lines (channels and trend lines).
Important speeches and reports (always contained in the news calendar) can greatly influence the movement of a currency pair. Therefore, during their exit, it is recommended to trade as carefully as possible or exit the market in order to avoid a sharp price reversal against the previous movement.
Beginners on Forex should remember that not every single trade has to be profitable. The development of a clear strategy and money management are the key to success in trading over a long period of time.


