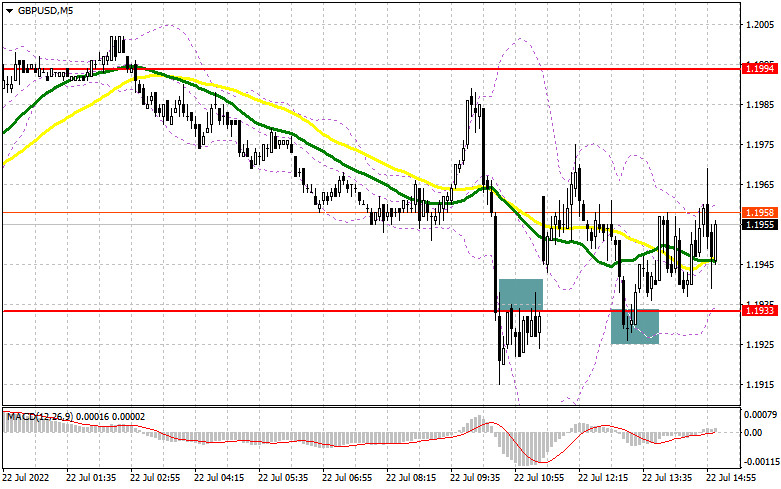
I highlighted the 1.1933 level in my morning forecast and advocated making market entry selections. Let's examine the 5-minute chart to determine what transpired there. The breach and retest of 1.1933 support in the first half of the day provided a great signal to sell the pound, but the release of positive UK economic data muddled the deck. As a result, we were required to repair losses and await new indications. A recovery to 1.1933 and a top-to-bottom retest of this level served as a buy signal for the pound, which at the time of writing was up 40 points from the entry point. From a technical standpoint, little has changed since the morning.
To establish long positions on the GBP/USD, you must:
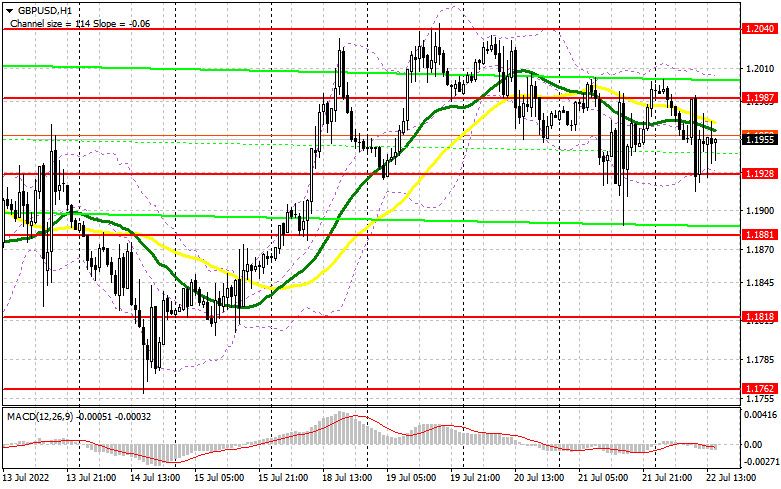
The indicator of business activity in the manufacturing sector, the index of business activity in the services sector, and the composite index of business activity from Markit will determine the market's direction after the week during the American session. Do not be shocked if the pressure on the pound reappears after the numbers are released, as strong indicators are anticipated. When the pair declines, only the formation of a false breakdown in the area of the new support 1.1928 constitutes a new signal to begin long positions in anticipation of a further pair recovery. In this situation, the goal will be the nearest resistance at 1.1987. A breakthrough and reversal test from the top to the bottom of this level will provide a stronger upward momentum, signaling a buy to jump and update 1.2040. A similar breach of this level would open the door to 1.2081 and 1.2119, where I would propose locking in profits. The 1.2160 region will serve as a further-off objective. If GBP/USD falls and there are no buyers at 1.1928, pressure will rise on the pound. I suggest delaying long positions until 1.1881. I encourage you to only purchase there on a fake decline. It is conceivable to initiate long bets on GBP/USD immediately for a rebound from 1.1818, or even lower – around 1.1762, with the goal of a 30-point-per-day drop.
To open short GBP/USD positions, you must have:
In the initial half of the day, sellers attempted to remind themselves, but robust data prevented them from establishing a broader negative trend. The optimum scenario for establishing short positions will be a false breakdown in the vicinity of the nearest resistance at 1.1987, which is very dependent. Beyond this range, the bulls can establish new long positions as the upswing continues. Strong US data will reapply pressure on the pair, with a target of 1.1928 as the morning support. Everything will depend on whether or not the bulls are still present. In the absence of their activity and the consolidation of GBP/USD below 1.1928, a reverse test from the bottom up of this level will provide an additional entry point to sell with a decline to 1.1881, where I advise partially locking in profits. The 1.1818 region will serve as a further-off objective. With the possibility of GBP/USD appreciation and the absence of bears with short positions at 1.1987, I encourage you not to rush. Only a false breakout at the weekly high of 1.2040 will provide an entry point for short options anticipating a pair comeback. If there is no activity there, there may be another upward jerk. With this option, I recommend delaying short positions between 1.2081 and 1.2119, where you can sell GBP/USD immediately for a comeback, betting on a 30-35-point drop within a day.

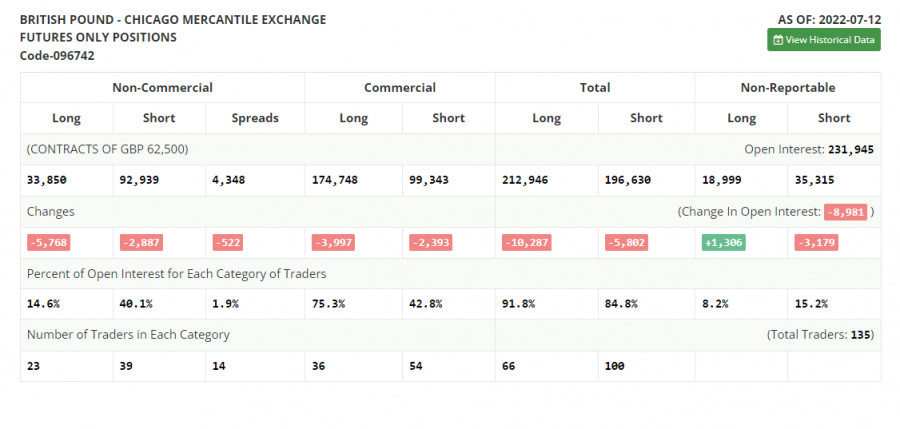
The COT report (Commitment of Traders) for July 12 revealed a decline in both short and long holdings. However, the fall in short positions was significantly larger, resulting in a rise in the negative delta. Another attempt to buy back the yearly minimum failed, but towards the end of the week, traders began to take profits using robust statistics on the United States, resulting in a minor correction of the pound, which has been asking for quite some time. The cost of living crisis in the United Kingdom persists, and the government has been unable to intervene. Simultaneously, the Federal Reserve System policies and the pace of increase in interest rates in the United States, paired with the next predicted increase of nearly 1 percent, provide a great deal of support for the dollar, causing the pound to fall more and farther. According to the COT report, long non-commercial positions declined by 5,768 to 33,850. In contrast, short non-commercial positions decreased by 2,887 to 92,939, resulting in an increase in the negative value of the non-commercial net position to -59,089 from -56,208. The weekly closing price declined to 1.1915 compared to 1.1965.

Signals of indicators:Moving AveragesTrading is below the 30-day and 50-day moving averages, indicating a bearish attempt to regain market control.The author considers the period and prices of moving averages on the hourly chart H1, which differs from the standard definition of daily moving averages on the daily chart D1.Bollinger BandsIn an upward trend, the indicator's upper limit at 1.2000 will act as resistance.Description of indicators
- Moving average (moving average determines the current trend by smoothing out volatility and noise). Period 50. The graph is marked in yellow.
- Moving average (moving average determines the current trend by smoothing out volatility and noise). Period 30. The graph is marked in green.
- MACD indicator (Moving Average Convergence / Divergence - moving average convergence/divergence) Fast EMA period 12. Slow EMA period 26. SMA period 9
- Bollinger Bands (Bollinger Bands). Period 20
- Non-profit speculative traders, such as individual traders, hedge funds, and large institutions use the futures market for speculative purposes and to meet certain requirements.
- Long non-commercial positions represent the total long open position of non-commercial traders.
- Short non-commercial positions represent the total short open position of non-commercial traders.
- Total non-commercial net position is the difference between the short and long positions of non-commercial traders.


