EUR/USD 5M
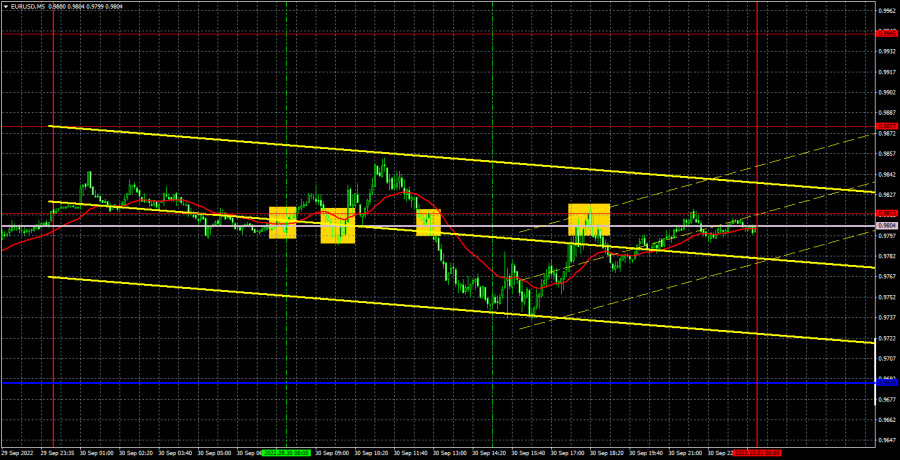
The EUR/USD pair tried to overcome the Senkou Span B line on Friday, but it failed to do so on the first attempt. Now the euro, which has been growing for only a few days so far, faces an important dilemma: either overcome the Senkou Span B line and count on some additional growth, or resume the fall. The European Union published a rather important September inflation report on Friday. Traders obviously did not expect to see the consumer price index rise immediately by 10%, but for some reason they rushed to sell the euro, and not buy it after the release of the data. From our point of view, each subsequent increase in inflation raises the likelihood of further European Central Bank rate hikes. Therefore, it would be logical to assume that the euro should show growth, not fall. But the market judged in its own way, the euro fell by 100 points, and during the rest of the day it almost completely won back these losses. The euro's prospects remain rather vague due to the fundamental and geopolitical background, but growth can also continue for some time on bare "technique".
In regards to Friday's trading signals, the situation was not the best. There was no pronounced flat that day, but all signals formed in the area of 0.9804-0.9813. The first buy signal was false, as the price was able to go up only 15 points. The position was closed by Stop Loss at breakeven. Then an ultra-inaccurate buy signal was formed, after which the price went up 23 points. The position again closed at breakeven. The next two sell signals should have been ignored, but even if traders tried to work them out, they still would not receive profits, since the price never reached the target level.
COT report:
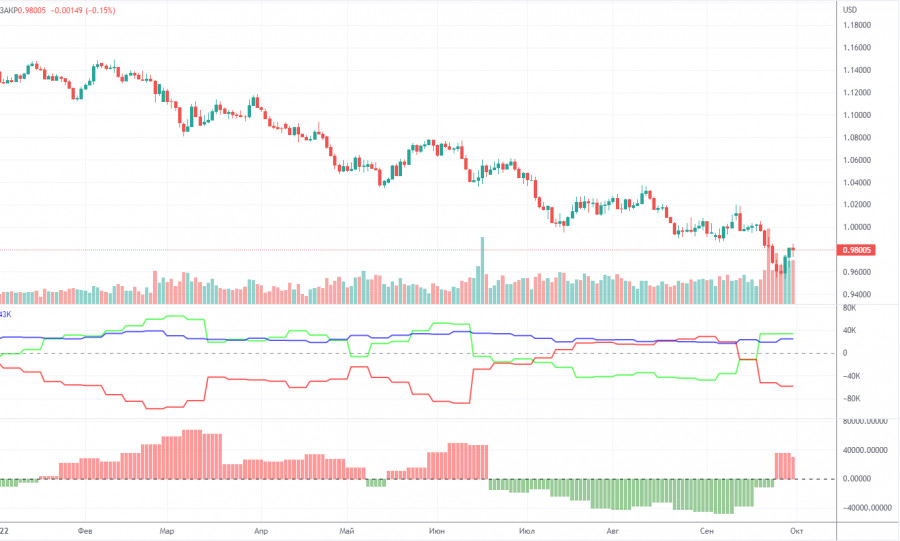
The Commitment of Traders (COT) reports on the euro in 2022 can be entered in the textbook. For half of the year, they showed a blatant bullish mood of commercial players, but at the same time, the euro fell steadily at the same time. Then they showed a bearish mood for several months, and the euro also fell steadily. Now the net position of non-commercial traders is bullish again, and the euro continues to fall. This happens, as we have said, because the demand for the US dollar remains high. Therefore, even if the demand for the euro is growing, the high demand for the dollar does not allow the euro itself to grow. During the reporting week, the number of long positions for the non-commercial group increased by 2,000, while the number of shorts decreased by 1,800. Accordingly, the net position grew by about 200 contracts. This is very small and this fact does not matter much, since the euro still remains "at the bottom". At this time, commercial traders still prefer the euro to the dollar. The number of long positions is higher than the number of shorts for non-commercial traders by 34,000, but the euro cannot derive any dividends from this. Thus, the net position of the non-commercial group can continue to grow further, this does not change anything. Even if you pay attention to the total number of longs and shorts, their values are approximately the same, but the euro is still falling. Thus, it is necessary to wait for changes in the geopolitical and/or fundamental background.
We recommend to familiarize yourself with:
Overview of the EUR/USD pair. October 3. Geopolitics can bring down the euro with renewed vigor.
Overview of the GBP/USD pair. October 3. The clouds are gathering over Liz Truss. Will she follow in the footsteps of Boris Johnson or become the new "Margaret Thatcher"?
Forecast and trading signals for GBP/USD on October 3. Detailed analysis of the movement of the pair and trading transactions.
EUR/USD 1H
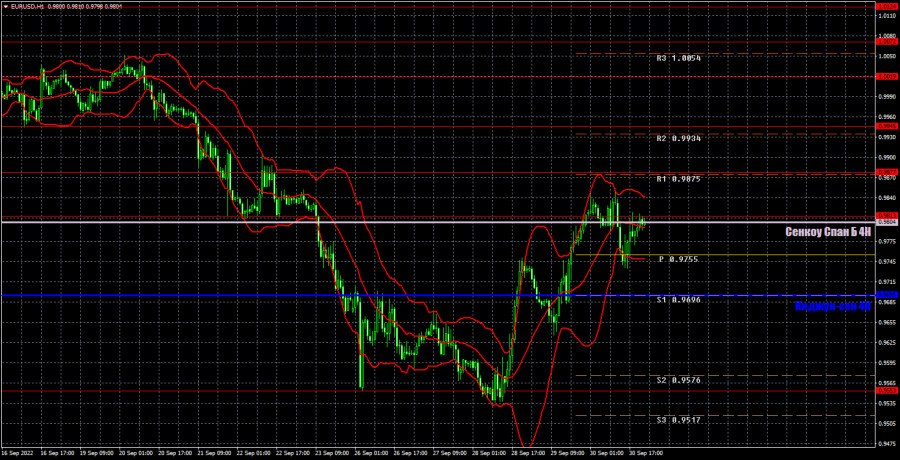
The trend began to change to an upward one on the hourly timeframe. Despite the fact that almost all types of backgrounds remain a failure for the euro, as well as the economic prospects of the European Union, the market still cannot sell the euro forever. Perhaps now we are entering a 2-3 month period of growth. The main thing is that the pair manages to settle above the Senkou Span B line. Without this, it will be difficult to count on growth. We highlight the following levels for trading on Monday - 0.9553, 0.9813, 0.9877, 0.9945, 1.0019, as well as the Senkou Span B (0.9804) and Kijun-sen (0.9695) lines. Ichimoku indicator lines can move during the day, which should be taken into account when determining trading signals. There are also secondary support and resistance levels, but no signals are formed near them. Signals can be "rebounds" and "breakthrough" extreme levels and lines. Do not forget about placing a Stop Loss order at breakeven if the price has gone in the right direction for 15 points. This will protect you against possible losses if the signal turns out to be false. The European Union and the United States will publish indexes of business activity in the manufacturing sector. The US ISM index is more significant, we expect some market reaction to it, but everything will depend on the deviation of the actual value from the forecast.
Explanations for the chart:
Support and Resistance Levels are the levels that serve as targets when buying or selling the pair. You can place Take Profit near these levels.
Kijun-sen and Senkou Span B lines are lines of the Ichimoku indicator transferred to the hourly timeframe from the 4-hour one.
Support and resistance areas are areas from which the price has repeatedly rebounded off.
Yellow lines are trend lines, trend channels and any other technical patterns.
Indicator 1 on the COT charts is the size of the net position of each category of traders.
Indicator 2 on the COT charts is the size of the net position for the non-commercial group.


